System Builder Marathon Q1 2014: System Value Compared
Overall Performance And Efficiency
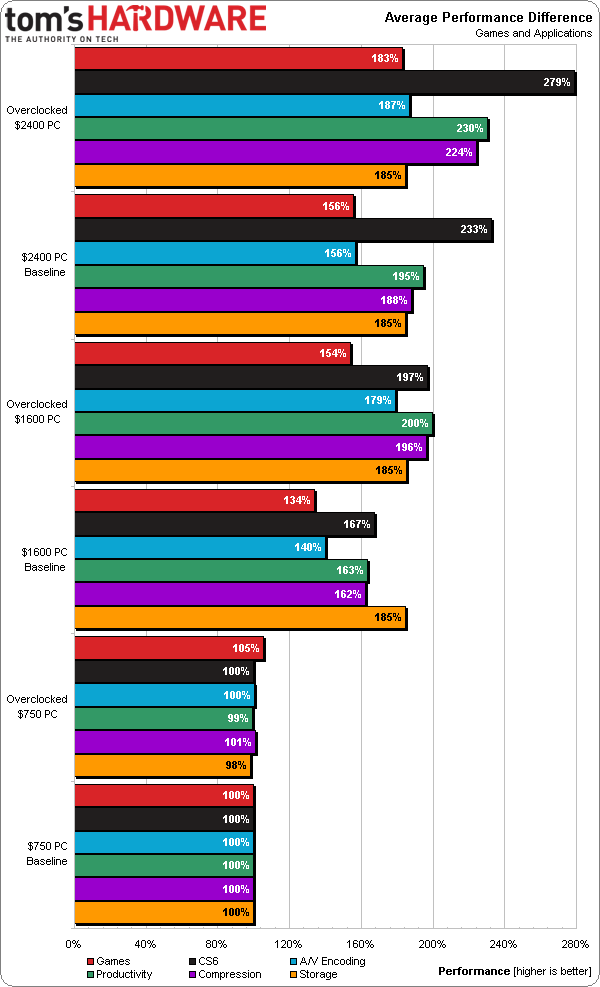
Christopher Ryan, our storage expert, might be able to show you the performance difference between my machine's 256 GB SSD and the $1600 machine’s 120 GB device, PCMark’s productivity, content creation, and gaming traces do not. Then again, load times are also affected by the number of CPU cycles it takes to load these apps into RAM. Both machines score 85% higher than the hard drive-equipped $750 PC.
Gamers will be more interested in the ~18% difference between a single GeForce GTX 780 Ti and dual GeForce GTX 780s. But those are averages. Several benchmarks are bottlenecked at our lower test settings, so we need to address higher resolutions separately.
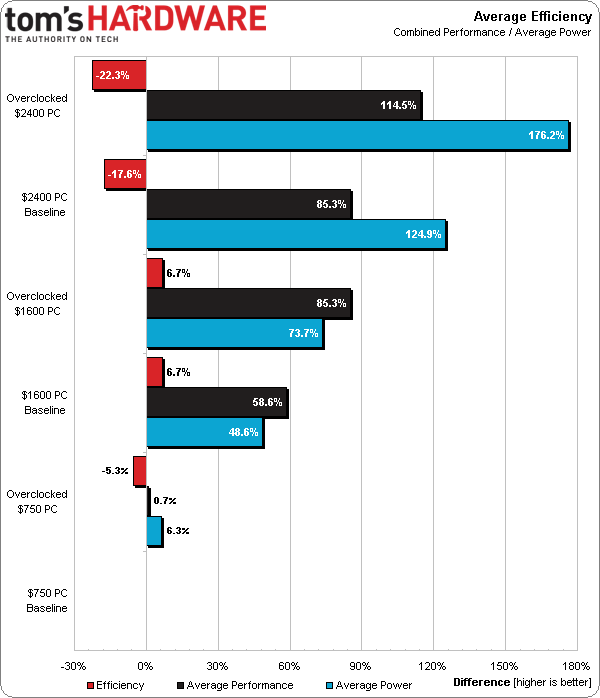
Nothing short of a perpetual motion machine could be more than 100% efficient, so our efficiency chart is zeroed out by subtracting one (100%) from its performance/efficiency calculations.
Remembering how miserly the $750 PC appeared in our power charts, its loss in average efficiency is a surprise. The $1600 PC had some minor configuration issues, so its efficiency win is also surprising. In the end, Don's build gets there by performing up to 85% better than the $750 machine, while using less than 74% more power.
Get Tom's Hardware's best news and in-depth reviews, straight to your inbox.
Current page: Overall Performance And Efficiency
Prev Page Power Consumption And Heat Next Page Picking A Performance-Value Winner-
neiroatopelcc You really should add noise measurements on those builds. I'd much rather have a low noise system with mediocre performance than a fast but loud system. For that reason I returned my 7990 card in december and decided to stick with my trusty old 6950 that wasn't causing tinitusReply -
redgarl Value is such a contradicting analysis. If your goal is to be 4k ready, the the two cheapest build are not going to make the cut. It's all depending on your needs.Also, for any single graphic card, I would cut on the CPU. There is no need to link a 4770k with a single 780 GTX.Reply -
vertexx Nice work with the targeted High End Gaming value analysis! I'd 2nd switching it up so that Paul doesn't always win....Reply
A couple of thoughts:
1. Is it true that gaming only gets 20-30% of the overall performance weighting? If so, I'd suggest moving that up to at least 50%. Even though I'm one for a balanced system, I still think the amount of $$ you're spending on the graphics capability should be reflected more in the overall performance rating.
2. There is quite a bit of back-and-forth on the impact of power consumption on these forums, and I think this competition would be a great place to factor in and raise awareness on the real costs of power consumption. I understand that electricity costs and system use varies greatly. But I would add in another value analysis incorporating the present value of 3 years' electricity costs using a discount rate (simple excel function 'pv'). Of course you would have to make some broad assumptions around average power, hours of use per day, whether or not you idle the system 24x7, and electricity cost, but I think the present value of 3 year electricity cost would make a decent impact on your value calculations across these systems. -
neiroatopelcc Reply12974969 said:Of course you would have to make some broad assumptions around average power, hours of use per day, whether or not you idle the system 24x7, and electricity cost, but I think the present value of 3 year electricity cost would make a decent impact on your value calculations across these systems.
I would suggest making a forum poll regarding this. From my steam library I can tell that I've been playing games on average 2.25 hours a day over the last 5 years, and since the bulk of my games are on steam (1400+) it's not much below my real usage. However despite being a gamer I find myself having the computer either idle or playing youtube etc for an amount equal to the time I'm playing games. Assuming I'm around average, with regards to gaming:idling ratio, that'd mean perhaps 3 hours gaming and 3 hours idle/video playback a day on average. -
geoffrey4283 I'm not sure if this is what Gin Fushicho is referring to, but SurveyGizmo has been subject to a DDoS attack for the last ~24 hours, making your contest survey inaccessible.Reply -
winwiz Yes to me and most people I know, cost for power and noise is more important than 199 FPS in BF4Reply -
geofelt A typo:Your $750 build used a i3-4130, not the i7-4770K listed in the tested configurationsReply -
de5_Roy the links at the top of the page aren't enabled. the 4th link for value comparison is disabled on all 3 of the sbm pages.Reply
i didn't agree with any of the motherboard choices in this quarter's build. despite that, all three builds were very interesting in terms of performance, choice of parts and builds.
my takeaway from this is that ddr3 1333 is not the baseline for cheap system memory anymore. 2x 4GB ddr3 1600 and higher, especially 2x 8GB ddr3 1866 or higher memory is optimum for performance. don not enabling xmp for the $1600 pc's stock performance analysis helped me understand this.
haswell i7 ramped power and heat really high after 4.4ghz and bit more voltage. both were higher than don's previous o.c. of i5 4670k with asus z87-a board. i still don't like asrock. can you guys compare o.c. clockrates, temperature and voltage of haswell cpus used in sbm in q4 to see which combo was better? imo it'd help with how haswell behaves in real pcs instead of open test benches or test pcs.


