EVGA 450 B3 PSU Review
Why you can trust Tom's Hardware
Cross-Load Tests & Infrared Images
Our cross-load tests are described in detail here.
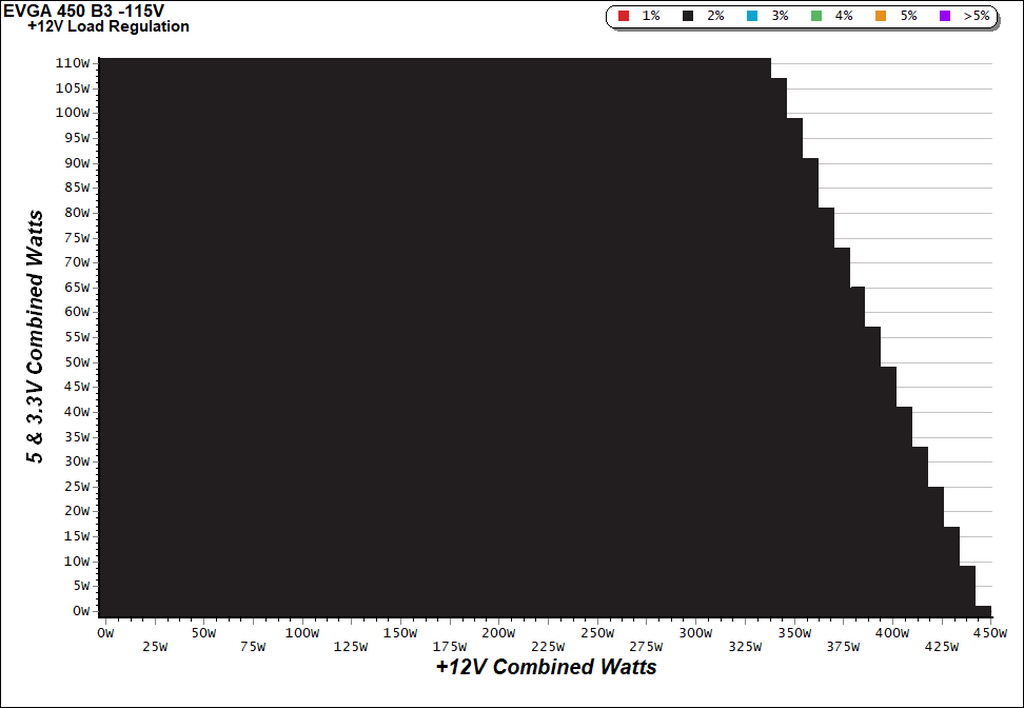
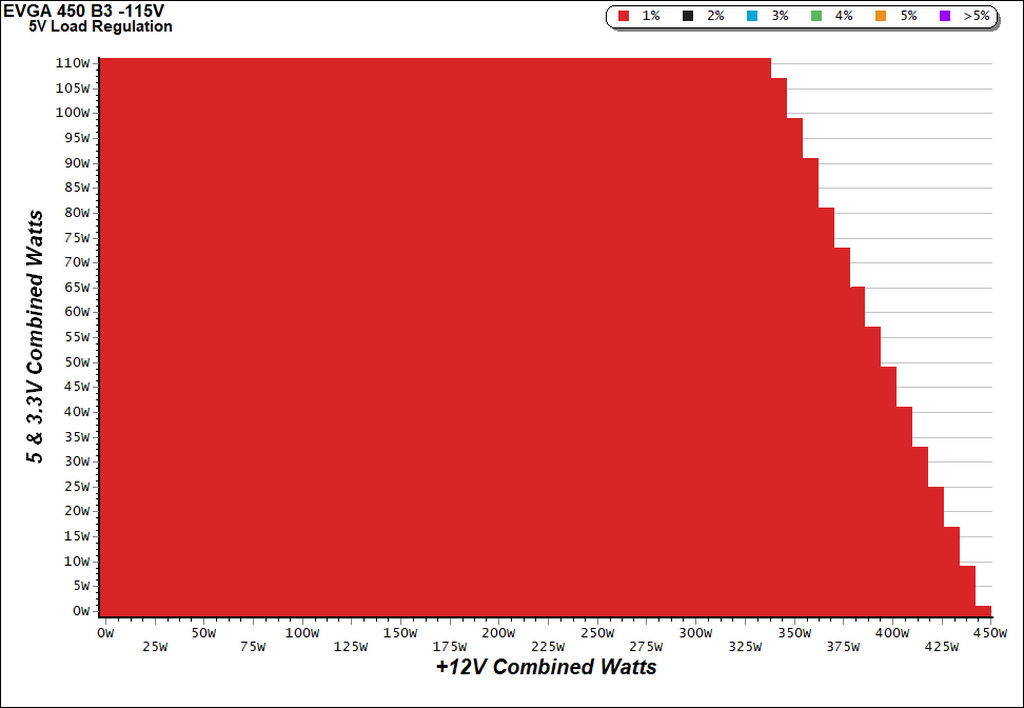
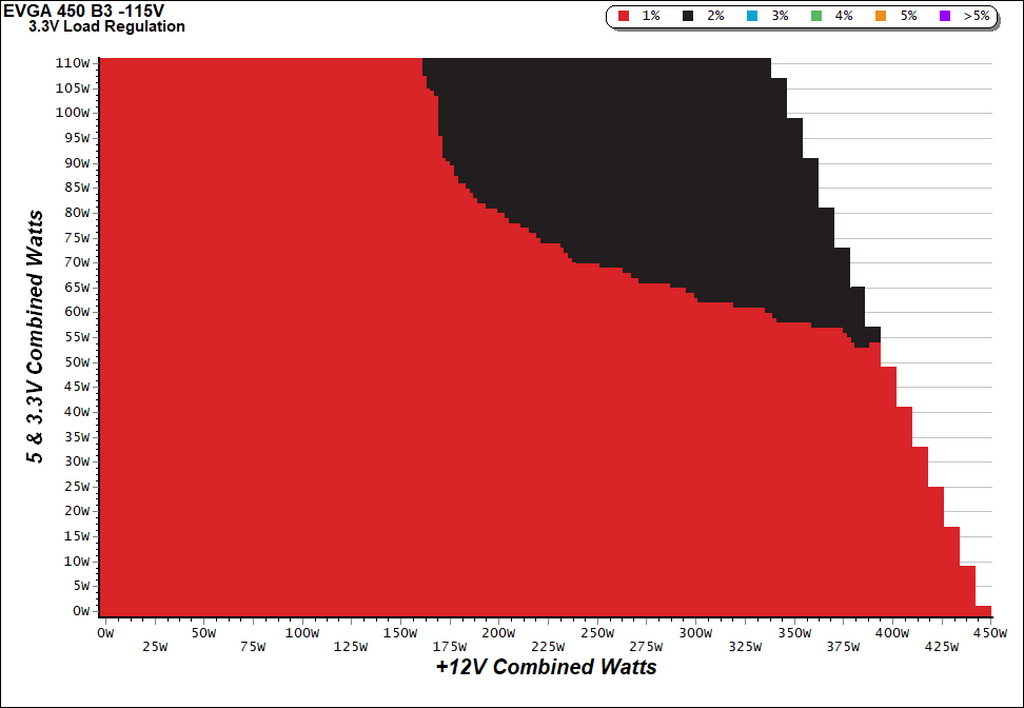
To generate the following charts, we set our loaders to auto mode through our custom-made software before trying more than 25,000 possible load combinations with the +12V, 5V and 3.3V rails. The load regulation deviations in each of the charts below were calculated by taking the nominal values of the rails (12V, 5V and 3.3V) as point zero. The ambient temperature was between at 30°C (86°F) to 32°C (89.6°F).
Load Regulation Charts
Efficiency Chart
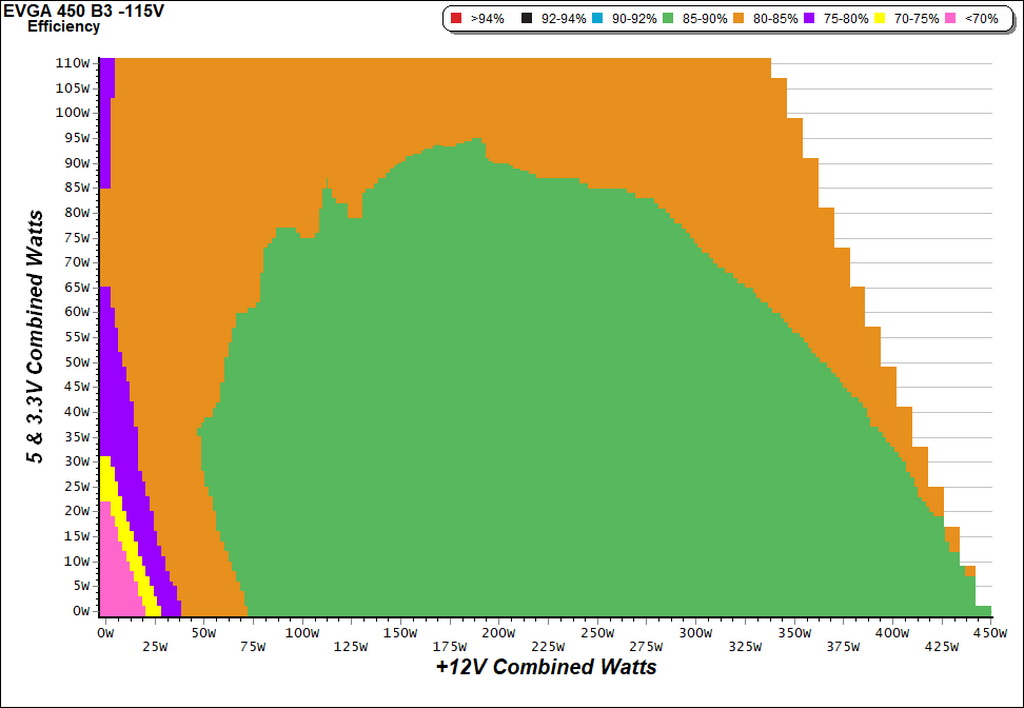
For most of this unit's efficiency map, we see 85-90% levels under 30-32°C operating temperatures. In order to achieve the highest possible efficiency, load on the minor rails has to be as low as possible.
Ripple Charts
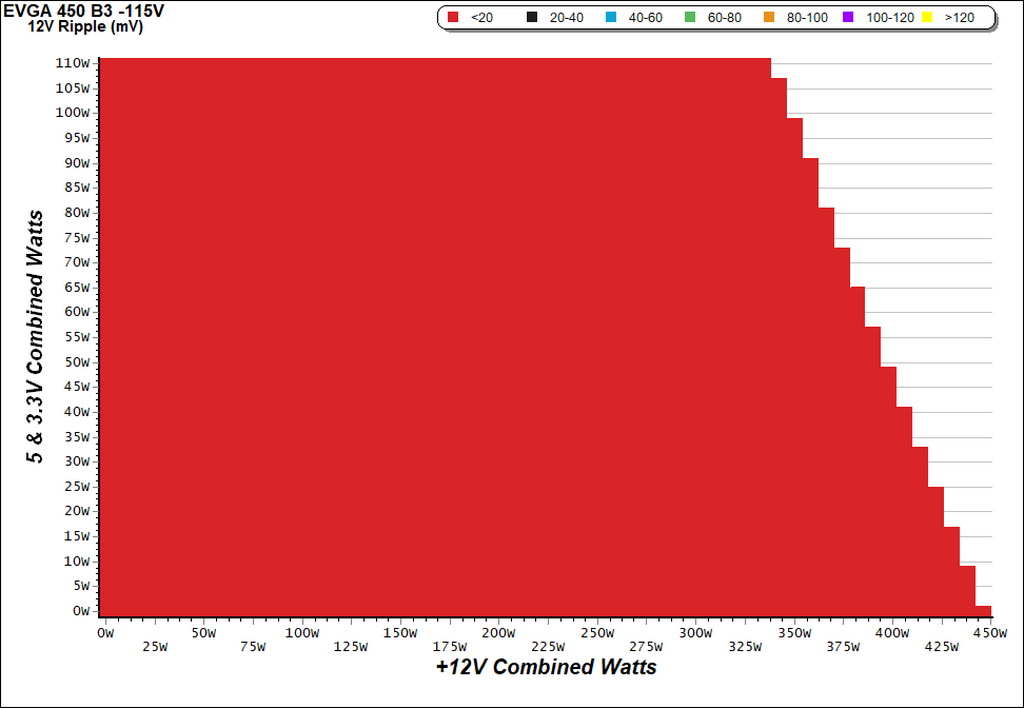
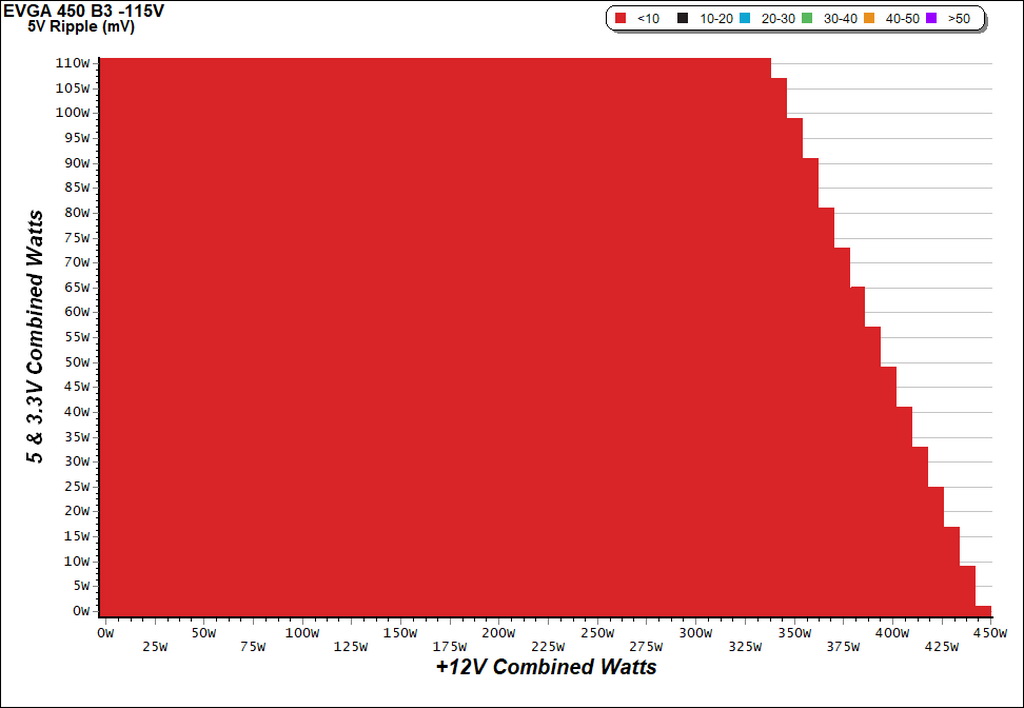
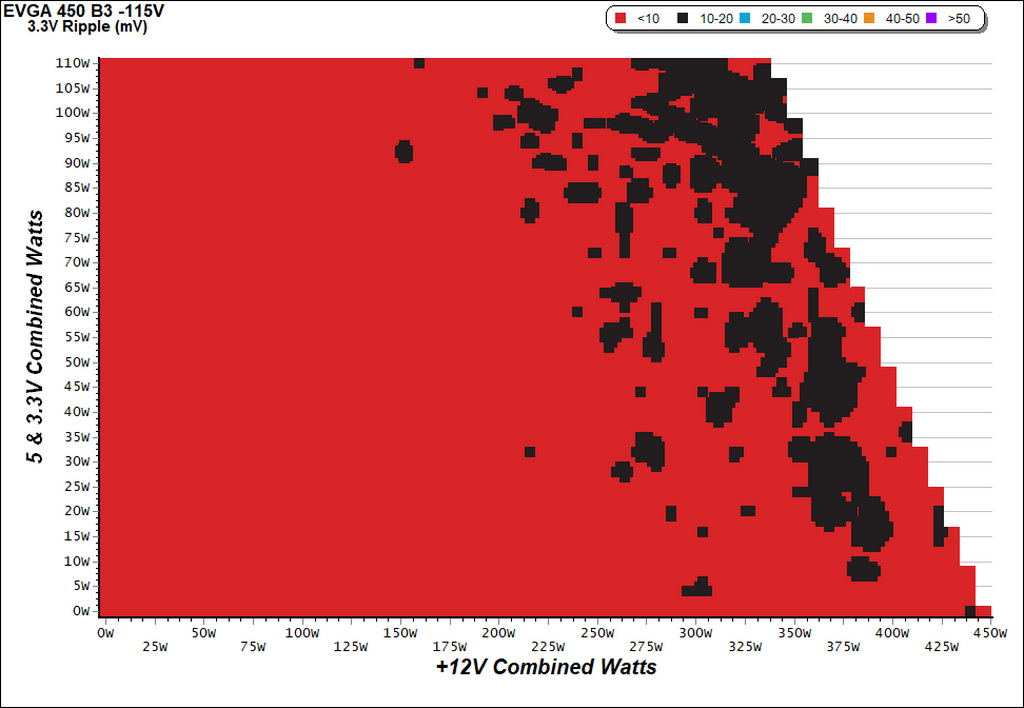
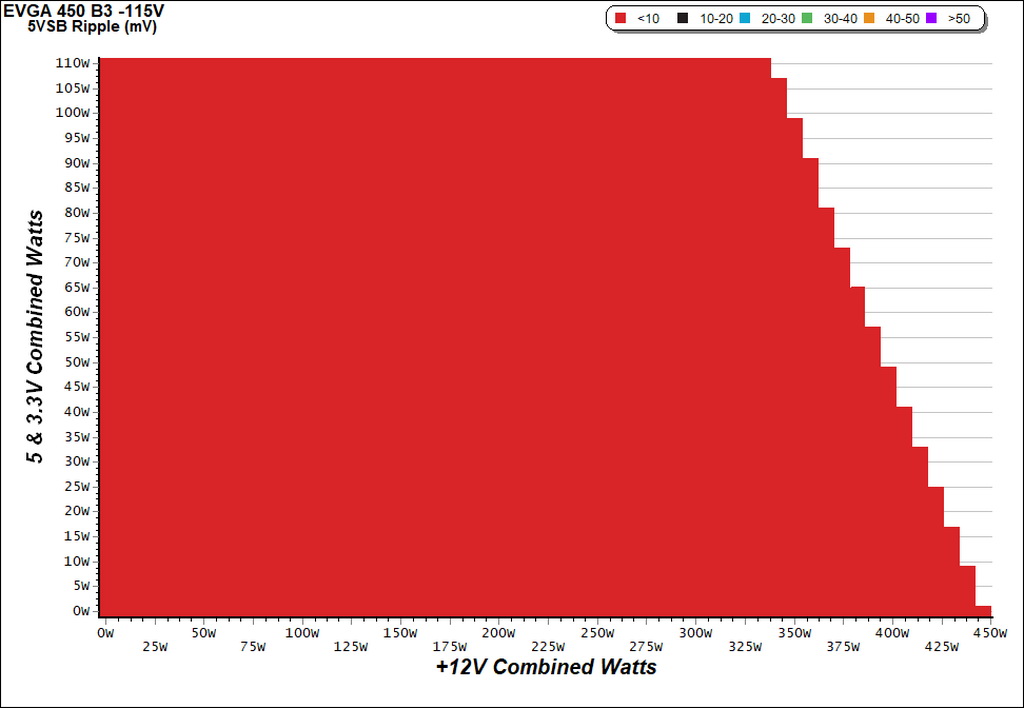
Infrared Images
Unfortunately, our PSU broke down during OPP testing, so we didn't have the chance to shoot any FLIR images. EVGA also didn't offer us another sample.
MORE: Best Power Supplies
MORE: How We Test Power Supplies
MORE: All Power Supply Content
Get Tom's Hardware's best news and in-depth reviews, straight to your inbox.
Current page: Cross-Load Tests & Infrared Images
Prev Page Protection Features & The OPP Flaw Next Page Transient Response Tests
Aris Mpitziopoulos is a contributing editor at Tom's Hardware, covering PSUs.
-
InvalidError Throwing higher current components at a problem isn't always the correct solution, especially when a 450W PSU is delivering somewhere north of 550W. The B3's components are clearly vastly sufficient to handle its rated load or even the 580W overload, which means the most likely reasons why a FET blew up are either a design flaw or manufacturing defect and the flaw/defect isn't necessarily in the FET or its immediately related circuitry.Reply
In this case, it seems like EVGA/Superflower may have incorrectly set the OCP on the 12V rail. I hope they meant to set it to something more conservative like 40A instead of the 50+ it may have been at here.
As for the main fuse not blowing, that is normal: the fuse lives upstream from the APFC choke and most other filtering components while both the APFC and main switching transistors are connected to the APFC-boosted input hold-up capacitor. The transistor's lead blows up from the capacitor dumping its several joules of energy into the lead, the APFC chokes smooth out the current spike and the current seen by the fuse comes nowhere close to reaching its i2t rating. It is the capacitor's charge that blows up the transistor, not AC input current. -
Aris_Mp I strongly disagree. The main fuse has to blow when there is a short on the primary side, which clearly is the case here, else the PSU is a fire hazard if the automatic relay on the home's main electrical panel doesn't work as it should. The spark every time we connect the PSU to the mains means that high current passes through the circuit, however the fuse still remains intact. Another clue here is that our lab's relay on the electrical panel automatically dropped (saving the day), meaning that more than 15 Amps of current were drawn from this particular AC socket!! So clearly the PSU's fuse should have blown. Finally, I have seen a great number of blown PSUs so far and all have some common component failures: primary or APFC FETs, bridge rectifier(s), main fuse. In any case the main fuse has to go else the design has a serious flaw.Reply
Some FETs might have increased Amps on papers, however in real life things can be different especially when the high RDS (on) values increase the operating temperatures. The part though in this PSU which I am not so sure about is the bridge rectifier, since it can only handle 8 Amps at 100C and usually I see more than 100C at the bridge. So if the bridge goes up to 115-120C its max current drops close to 5A according to its spec sheet so we only have 575W handling, which is much below the 700-720W that the PSU draws from the wall with 580W load.
The APFC choke isn't for filtering purposes, but mainly for boosting voltage, this is why it is also called boost inductor. More about how the APFC converter works and an explanation on both most popular types (DCM, CCM) can be found here: http://www.tomshardware.com/reviews/power-supplies-101,4193-10.html. I think it is pointless to explain APFC's operation here since there is an entire section about it. The bulk cap's charge didn't exactly blow the FET, the FET just couldn't handle the increased Amperage that the cap provided because of the high load. Also the bulk cap drew this load from the mains network and didn't make it out of thin air!
Finally please don't lose sight of the forest for the trees and confuse the readers on a subject that is clear. The fuse that protects the socket into which the PSU was connected dropped, meaning that more than 15 Amps passed through it! Given that this PSU's bridge can only handle up to 8 Amps normally its fuse should be less than 8A, however it survived not once, but both times that we tried it! This clearly shows a major flaw and on the same times proves that there is a short on the PSU's primary side, which draws LOTS of current! In any case the main fuse should open the circuit in order to protect the user and the equipment from damage or even fire. The main fuse not blowing is anything else but normal! I just have to point this out -
kalmquist $50 for a modular power supply seems like a great deal, even with merely Bronze efficiency. This is a good reminder not to gamble on a PSU that hasn't been reviewed by a site like Tom's Hardware.Reply -
InvalidError Reply
Put a 1mH APFC choke in series with a short circuit and 350V, it'll limit current rise time seen from the input side to 350A/ms, so it does filter regardless of what its other purposes in the circuit is just like any inductor would.20089501 said:The APFC choke isn't for filtering purposes
I missed the paragraph about the breaker tripping. If you have RCDs or AFCI breakers, they could be tripping due to faults other than a short-circuit. If you have class-A relays, it could also be tripping faster than the fuse is able to blow.
Edit: missing a 0... 350V/1mH = 350A/ms. -
AndrewJacksonZA Is this the PSU in the video at JG of the PSU that blew up in your lab, Aris? :-)Reply -
10tacle ReplyBut we are seriously troubled by its issue and EVGA's lack of a response when we probed for possible causes.
That is deeply troubling, especially coming from a highly reputable hardware vendor like EVGA and who I have nothing but the highest respect for (I've been buying their GPUs solely since the GTX 275).
I sincerely hope EVGA isn't quick to get back because they are trying to find a root cause with Superflower and rule in or out a bad manufacturing batch that got past Superflower, or a bad design. I hope for EVGA it's the former.
-
Aris_Mp @INVALIDERROR I will try this in a circuit simulation program I have, once I find some free time.Reply
@ANDREWJACKSONZA If you mean about the blowing PSU in smokes, nope this is another PSU.
@10TACLE Once we have a response from EVGA we will post it of course. To be frank I waited for a second sample from the time I notified about this problem, however I was not offered one. Also from the start EVGA didn't send any B3 samples and this is why I had to buy them on my own (given the popularity of this line), in order to check them out. With the first chance I will also buy affordable PSUs from other vendors, which usually aren't offered as review samples, in order to evaluate them.
I would buy another 450 B3 but it is out of stock every where I searched in Europe. If I manage to find one I will try the same test again of course. Nonetheless I faced problems with other B3 models as well, which I will mention in the next B3 review. -
80-watt Hamster I don't find it all that surprising that they didn't shoot for a higher efficiency rating. EVGA's primary market is the US (correct me if I'm wrong), and Silver is basically a non-entity here. Bronze is the volume segment, so having a strong contender there is a necessity, and pushing it to Gold would add to an already-crowded segment of their product stack.Reply -
Onus As nasty as that blow-up might be, if used in a machine that doesn't need more than 450W, is it really a problem? Arguably, someone who tries to run a 600W PC using a 450W PSU deserves what he gets. For low-end systems, this looks like a perfectly viable choice.Reply
