SSD Deathmatch: Crucial's M500 Vs. Samsung's 840 EVO
Micron's consumer products division, Crucial, wasn't the first brand to introduce a 1 TB SSD. But it was the first to sell one for less than a fortune, and it sports some snazzy new features to boot. We got our hands on the entire line-up to test.
Results: Tom's Storage Bench, Continued
Service Times
Beyond the average data rate reported on the previous page, there's even more information we can collect from Tom's Storage Bench. For instance, mean (average) service times show what responsiveness is like on an average I/O during the trace.
It would be difficult to graph the 10+ million I/Os that make up our test, so looking at the average time to service an I/O makes more sense. For a more nuanced idea of what's transpiring during the trace, we plot mean service times for reads against writes. That way, drives with better latency show up closer to the origin; lower numbers are better.
Write latency is simply the total time it takes an input or output operation to be issued by the host operating system, travel to the storage subsystem, commit to the storage device, and have the drive acknowledge the operation. Read latency is similar. The operating system asks the storage device for data stored in a certain location, the SSD reads that information, and then it's sent to the host. Modern computers are fast and SSDs are zippy, but there's still a significant amount of latency involved in a storage transaction.

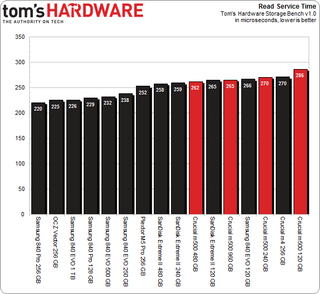
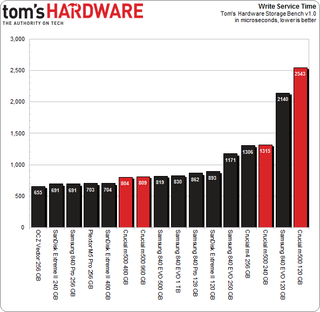
In the chart above, drives that finish closer to the bottom offer better write latency. Moreover, the further you go to the left, the better the read latency is.
With that in mind, all four M500s are comparably quick when it comes to read access times in our trace. Write latency is another story, though. We've already established that write speed is heavily dependent on a drive's total number of dies and the controller's ability to utilize them in parallel. Up to a point, more flash devices give you lower write latency. This is evident in the massive spread between 120, 240, 480, and 960 GB M500s. Clearly, they're a lot further apart vertically than horizontally.
The 480 and 960 GB drives are fairly similar in all of our benchmarks. In fact, the 480 GB model gets a slight performance edge, suggesting that's the sweet spot right now with 128 Gb NAND and Marvell's 9187 controller.
Stay on the Cutting Edge
Join the experts who read Tom's Hardware for the inside track on enthusiast PC tech news — and have for over 25 years. We'll send breaking news and in-depth reviews of CPUs, GPUs, AI, maker hardware and more straight to your inbox.

All of the SSDs we're testing occupy a very narrow range of service times. Really, every product easily knocks our real-world read-based workload out of the part. If we're to get specific, Samsung's drives are the quickest, though we can't say if that's from their three-core controllers or faster flash memory. It's entirely possible that a slower interface is to blame for the M500's slightly lower results.

This trace has over twice as many read I/Os as writes, though writes account for more throughput. And here's where the testing gets dicey for Crucial's smaller M500s.
The 256 GB-class m4 and M500 behave almost identically. Samsung's 840 EVO drives enjoy a huge advantage due to Turbo Write, which emulates SLC. SanDisk's submissions do as well, since they also sport a technology that replicates the behavior of SLC, called nCache. Likewise, the OCZ Vector leverages a similar capability, though each specific implementation is different. OCZ's approach is the quickest of the three, taking first place in our trace for writes and second place for reads.
Crucial's M500 doesn't benefit from those fancy caching features, but rather holds its own through a more conventional design. The two larger models, specifically, perform admirably.
Current page: Results: Tom's Storage Bench, Continued
Prev Page Results: Tom's Storage Bench v1.0 Next Page Results: PCMark 7 And PCMark Vantage-
Someone Somewhere I think you mixed up the axis on the read vs write delay graph. It doesn't agree with the individual ones after, or the writeup.Reply -
Someone Somewhere Even 3bpc SSDs should last you a good ten years...Reply
The SSD 840 is rated for 1000 P/E cycles, though it's been seen doing more like ~3000. At 10GB/day, a 240GB would last for 24,000 days, or about 766 years, and that's using the 1K figure.
You're free to waste money if you want, but SLC now has little place outside write-heavy DB storage.
EDIT: Screwed up by an order of magnitude. -
cryan Reply11306005 said:I think you mixed up the axis on the read vs write delay graph. It doesn't agree with the individual ones after, or the writeup.
You are totally correct! You win a gold star, because I didn't even notice. Thanks for catching it, and it should be fixed now.
Regards,
Christopher Ryan
-
cryan Reply11306034 said:I would only buy SSD that uses SLC memory. I dont wan't to buy new drive every year or so.
Not only are consumer workloads completely gentle on SSDs, but modern controllers are super awesome at expanding NAND longevity. I was able to burn through 3000+ PE cycles on the Samsung 840 last year, and it only is rated at 1,000 PE cycles or so. You'd have to put almost 1 TB a day on a 120 GB Samsung 840 TLC to kill it in a year, assuming it didn't die from something else first.
Regards,
Christopher Ryan
-
Someone Somewhere I'd like to see some sources on that - for starters, I don't think the 840 has been out for a year, and it was the first to commercialize 3bpc NAND.Reply
You may be thinking of the controller failures some of the Sandforce drives had, which are completely unrelated to the type of NAND used. -
mironso Well, I must agree with Someone Somewhere. I would also like to see sources for this statement: "Yes, in theory they last 10 years, in practise they last a year or so.".Reply
I would like to see, can TH use SSD put this 10GB/day and see for how long it will work.
After this I read this article, I think that Crucial's M500 hit the jackpot. Will see Samsung's response. And that's very good for end consumer. -
edlivian It was sad that they did not include the samsung 830 128gb and crucial m4 128gb in the results, those were the most popular ssd last year.Reply -
Someone Somewhere You can also find tens of thousands of people not complaining about their SSD failing. It's called selection bias.Reply
Show me a report with a reasonable sample size (more than a couple of dozen drives) that says they have >50% annual failures.
A couple of years ago Tom's posted this: http://www.tomshardware.com/reviews/ssd-reliability-failure-rate,2923.html
The majority of failures were firmware-caused by early Sandforce drives. That's gone now.
EDIT: Missed your post. First off, that's a perfect example of self-selection. Secondly, those who buy multiple SSDs will appear to have n times the actual failure rate, because if any fail they all appear to fail. Thirdly, that has nothing to do with whether or not it is a 1bpc or 3 bpc SSD - that's what you started off with.
This doesn't fix the problem of audience self-selection
-
Someone Somewhere You were however trying to stop other people buying them...Reply
Sounds a bit like a sore loser argument, unfortunately.
SSDs aren't perfect, but they generally do live long enough to not be a problem. Most of the failures have been overcome by now too.
Just realised there's an error in my original post - off by a factor of ten. Should have been 66 years. -
warmon6 Reply11306841 said:I am not talking about Samsung SSD-s, I am talking about SSDs in general. And I am not going to provide any sources because SSD fail all the time after a year or so. That is the raility. You can find, on the internet, people complaining abouth their SSD failing. There are a lot of them...
Also, SLC based SSD-s are usually "enterprise", so they are designed for reliability and not performance, and they don't use some bollocks, overclocked to the point of failure, controllers. And have better optimised firmware...
Tell that to all the people on this forum still running intel X-25M that launched all the way back in 2008 and my Samsung 830 that's been working just fine for over a year.......
See what you're paying attention too is the loudest group of ssd owners. The owners that have failed ssd's.
See it's the classic "if someone has a problem, there going to be the one that you hear and the quiet group, isn't having the problem" issue.
Those that dont have issues (such as myself) dont mention about our ssds and is probably complaining about something else that has failed.
Most Popular

