
Why you can trust Tom's Hardware Our expert reviewers spend hours testing and comparing products and services so you can choose the best for you. Find out more about how we test.
Comparison Products
We put two mainstream contenders, the Adata XPG SX8200 Pro and MyDigitalSSD BPX Pro (similar to the P34A80), up against the P34A60. As direct competition, we threw in the Crucial P1, WD Blue SN500, and a Crucial MX500 SATA SSD. We also added in Intel Optane 905P and a 6TB WD Black HDD for reference.
Game Scene Loading - Final Fantasy XIV
The Final Fantasy XIV StormBlood benchmark is a free real-world game benchmark that easily and accurately compares game load times without the inaccuracy of using a stopwatch.

Loading your favorite games is a relatively light task for any SSD; most perform similarly. At a total load time of 19.5 seconds, the P34A60 put up a great result that is a step ahead of most SATA SSDs.
Transfer Rates – DiskBench
We use the DiskBench storage benchmarking tool to test file transfer performance with our own custom 50GB block of data. Our data set includes 31,227 files of various types, like pictures, PDFs and videos. We copy the files to a new folder and then follow-up with a reading test of a newly written 6.5GB file.


The P34A60's read performance is limited due to the lower-power and less feature-packed controller. But by virtue of its TLC NAND, it scored ahead of the Crucial P1 with its QLC NAND flash, and even beat the WD Blue SN500 in read and copy performance. It even outperformed the BPX Pro during the 50GB copy, which, in essence, outperformed its more expensive brother, the P34A80, at the 512GB capacity point.
Trace Testing – PCMark 8 Storage Test 2.0
PCMark 8 is a trace-based benchmark that uses Microsoft Office, Adobe Creative Suite, World of Warcraft and Battlefield 3 to measure the performance of storage devices in real-world scenarios.


In terms of total responsiveness, the P34A60 can handle almost any consumer workload you throw at it. It scored similarly to the SN500 and offers a clear advantage over any SATA device.
Trace Testing – SPECworkstation 3
Like PCMark 8, SPECworkstation 3 is a trace-based benchmark, but it is designed to push the system harder by measuring workstation performance in professional applications.


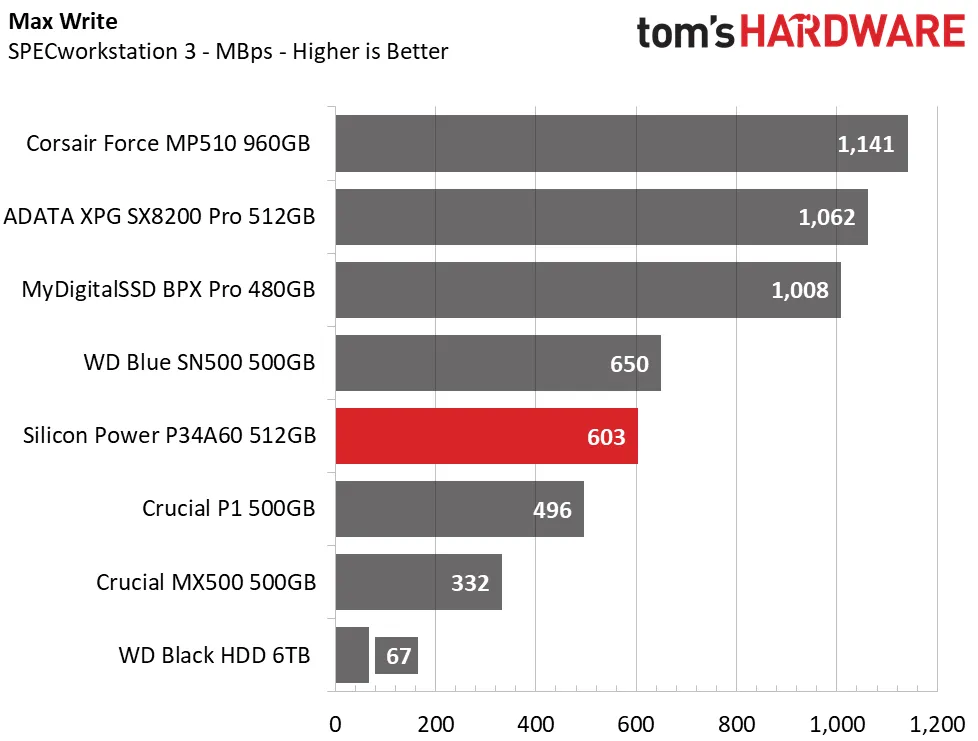
In prosumer tasks, the P34A60 scored the lowest of the NVMe group. It did, however, pull off a better total completion time than the Crucial P1 with higher average bandwidth and peak performance.
Synthetics - ATTO
ATTO is a simple and free application that SSD vendors commonly use to assign sequential performance specifications to their products. It also gives us insight into how the device handles different file sizes.


In ATTO, we tested the P34A60 at a queue depth (QD) of 4. It delivered better small file performance than the WD Blue SN500 and Crucial P1. Peak results came in at 2.1 GBps read and 1.7 GBps write. It couldn't keep up with the Adata XPG SX8200 Pro or Intel Optane 905P, however.
Synthetic Testing - iometer
The iometer storage benchmarking tool is advanced and highly configurable. Vendors often use this utility to measure the performance of their devices.


Iometer shows similar peak values of about 2.1GBps read and 1.7GBps write. The P34A60's performance is responsive and ranks just behind the Adata at a QD of 1. Peak performance comes in at about 220,000/175,000 read/write IOPS.
Sustained Write Performance & Temperature
Official write specifications are only part of the performance picture. Most SSD makers implement a write cache, which is a fast area of (usually) pseudo-SLC programmed flash that absorbs incoming data. Sustained write speeds can suffer tremendously once the workload spills outside of the cache and into the "native" TLC or QLC flash. We use iometer to hammer the SSD with sequential writes for 15 minutes to measure both the size of the write cache and performance after the cache is saturated.
When possible, we also log the temperature of the drive via the S.M.A.R.T. data to see when (or if) thermal throttling kicks in and how it impacts performance. Bear in mind that results will vary based on the workload and ambient air temperature.


Silicon Power’s P34A60 features a dynamic SLC write cache. We wrote 67GB of data before write speeds degraded. Once performance faltered, the drive fell from 1,650 MBps of write throughput down to an average of 140 MBps. When transferring a few hundred GB of data, temperatures hit a peak of 67 degrees Celsius with an ambient of 25 degrees Celsius (static air cooling).
Power Consumption
We use the Quarch HD Programmable Power Module to gain a deeper understanding of power characteristics. Idle power consumption is a very important aspect to consider, especially if you're looking for a new drive for your laptop. Some SSDs can consume watts of power at idle while better-suited ones sip just milliwatts. Average workload power consumption and max consumption are two other aspects of power consumption, but performance-per-watt is more important. A drive might consume more power during any given workload, but accomplishing a task faster allows the drive to drop into an idle state more quickly, which ultimately saves power.


The P34A60 came in first place in our efficiency tests. The drive averaged 2.5W of power consumption during the 50GB transfer and peaked at just over 3.5W. Due to HMB, however, idle power consumption is a bit higher than most SSDs.
MORE: Best SSDs
MORE: How We Test HDDs And SSDs
MORE: All SSD Content
