Why you can trust Tom's Hardware
Comparison Products
Today we’re putting the 2TB Crucial P5 against some of the best SSDs available. As top competitors, we included Samsung’s 970 EVO Plus, Adata’s XPG SX8200 Pro, and WD’s Black SN750. We also added in Sabrent’s wicked-fast PCIe 4.0 x4 Rocket NVMe 4.0 as well as the company’s Rocket Q (a fairly cheap QLC NVMe SSD). We included the Intel Optane SSD 905P and a Crucial MX500 for good measure.
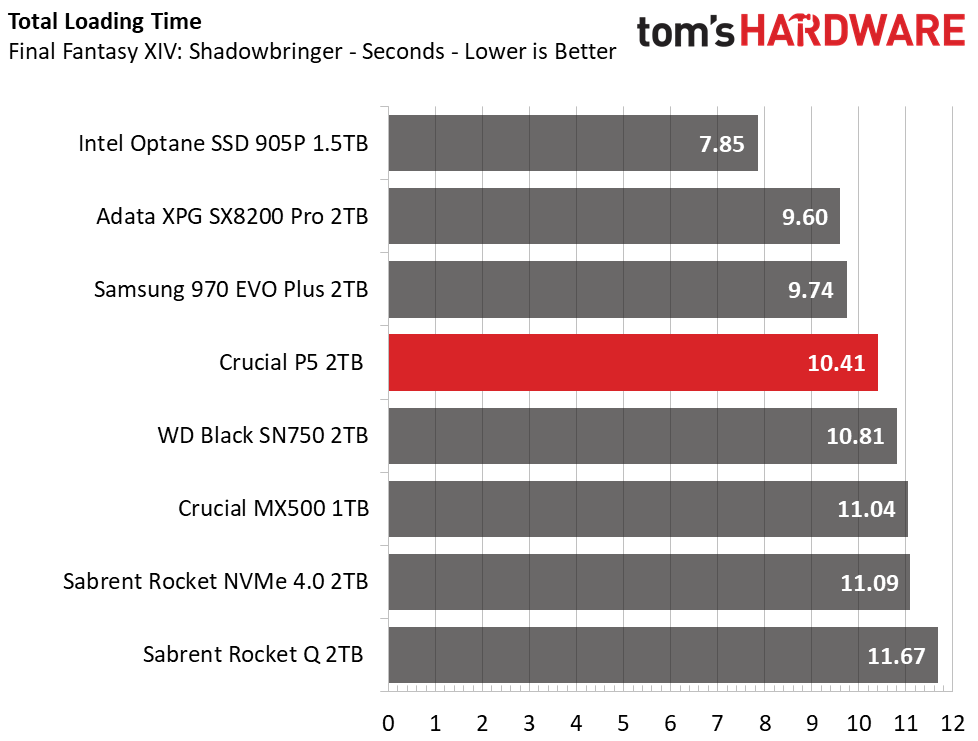
Game Scene Loading - Final Fantasy XIV
Final Fantasy XIV Stormbringer is a free real-world game benchmark that easily and accurately compares game load times without the inaccuracy of using a stopwatch.
Crucial’s P5 delivers responsive game load performance, but it’s not the fastest SSD for the task. Aside from the costly Intel Optane 905P, the Adata XPG SX8200 Pro and Samsung 970 EVO Plus respond faster to the benchmark’s requests over multiple game levels. However, the P5 outperforms both the WD Black SN750 and even the Sabrent Rocket NVMe 4.0. The P5 accomplishes this feat even though it operates on a slower PCIe 3.0 interface, which speaks to the refined firmware.
Transfer Rates – DiskBench
We use the DiskBench storage benchmarking tool to test file transfer performance with our own custom blocks of data. Our 50GB data set includes 31,227 files of various types, like pictures, PDFs, and videos. Our 100GB includes 22,579 files, with 50GB of them being large movies. We copy the data sets to new folders and then follow-up with a reading test of a newly written 6.5GB zip file and 15GB movie file.
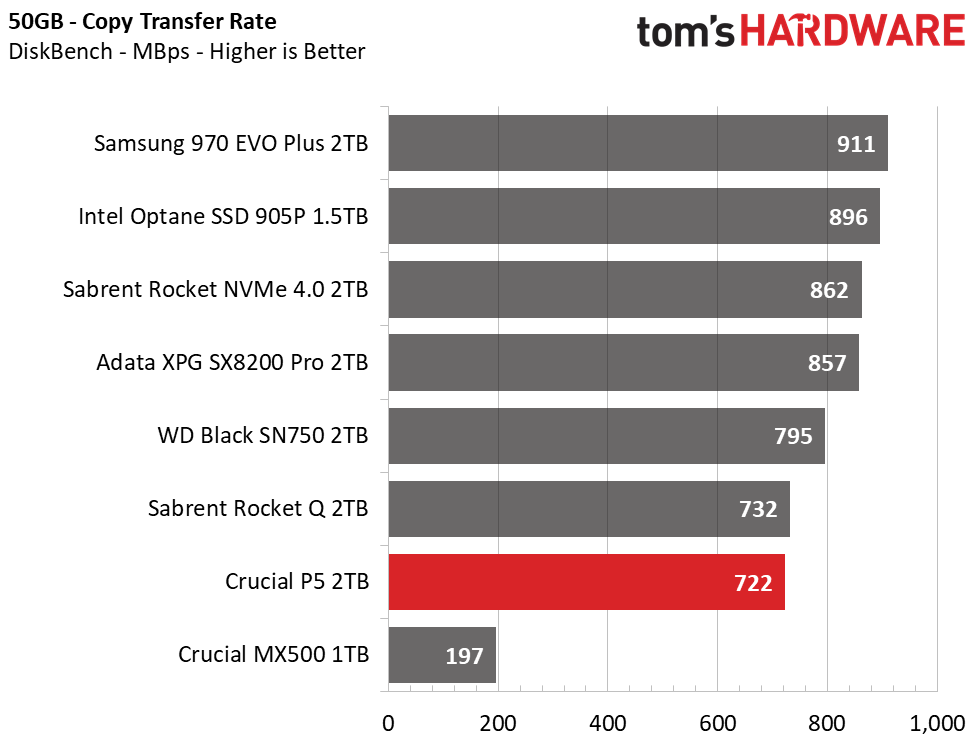
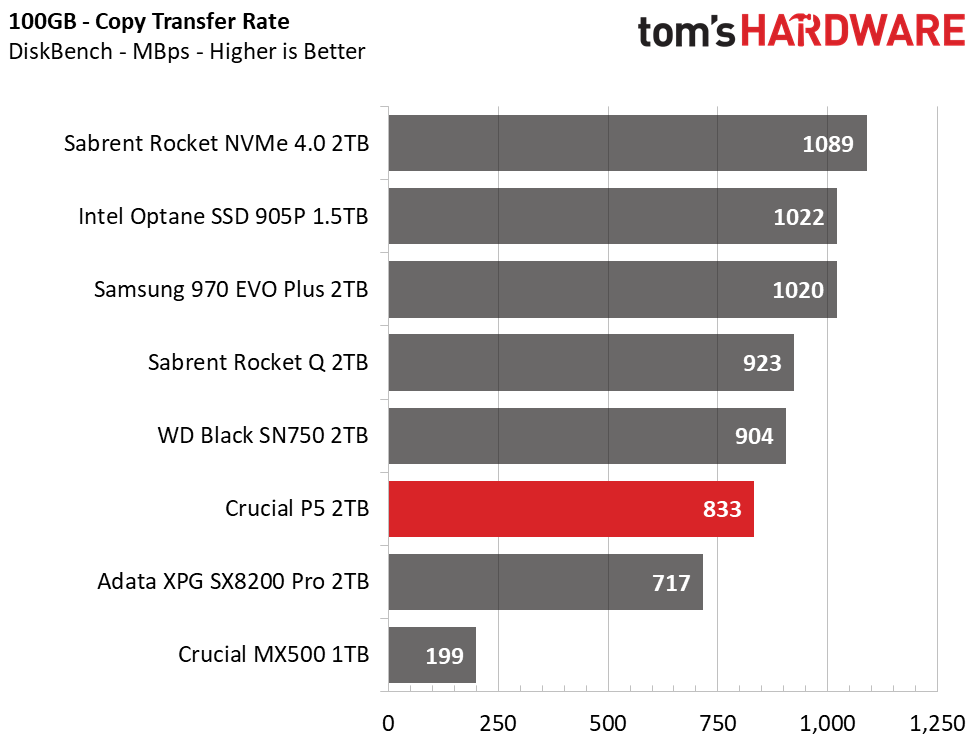
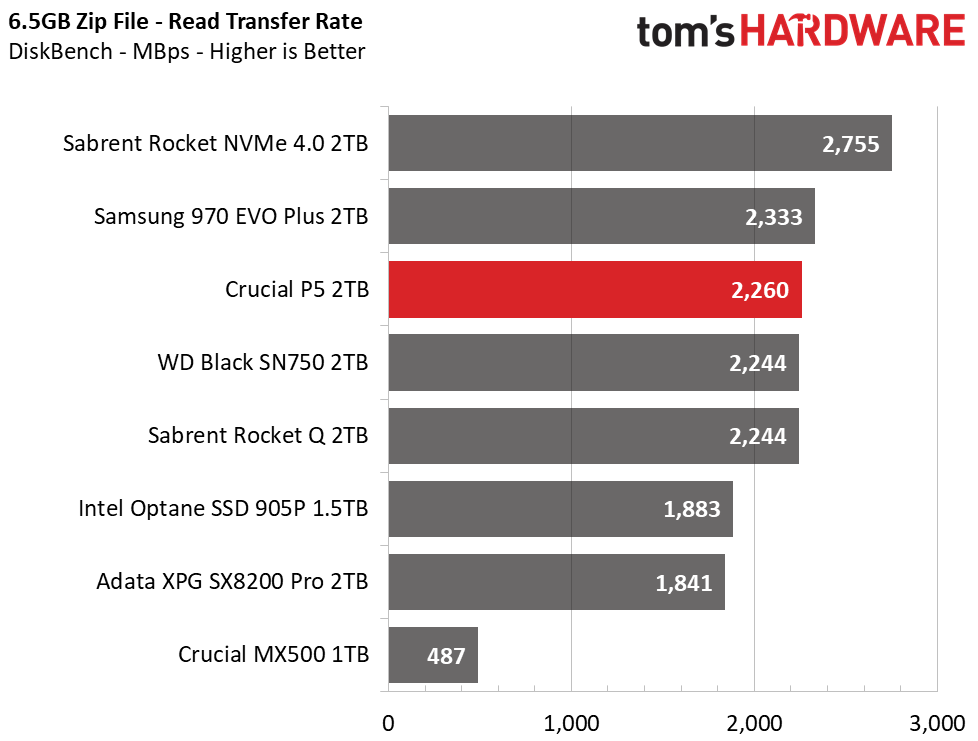
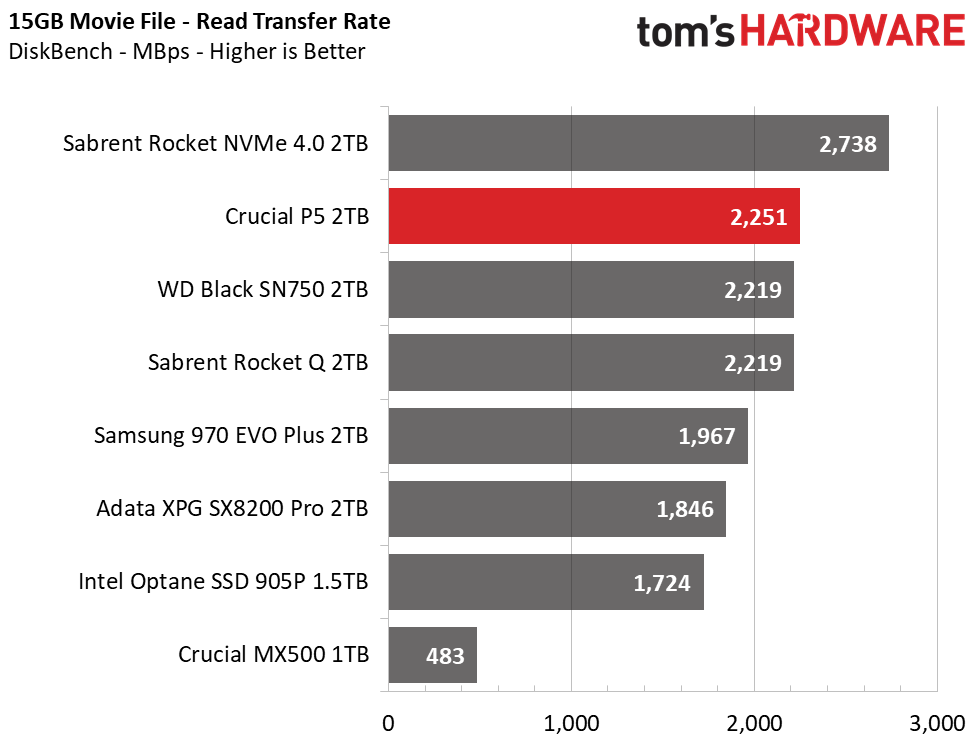
The Crucial P5 is among the fastest high-end PCIe 3.0 x4 SSDs when it reads large files. However, while Crucial’s P5 packs a lot of processing grunt, it’s still not enough to help it gain top marks in the large-file copy tests. Sure, it outperformed the Crucial MX500, but it lagged its direct competitors.
Trace Testing – PCMark 10 Storage Tests
PCMark 10 is a trace-based benchmark that uses a wide-ranging set of real-world traces from popular applications and common tasks to measure the performance of storage devices. The quick benchmark is more relatable to those who use their PCs for leisure or basic office work, while the full benchmark relates more to power users.
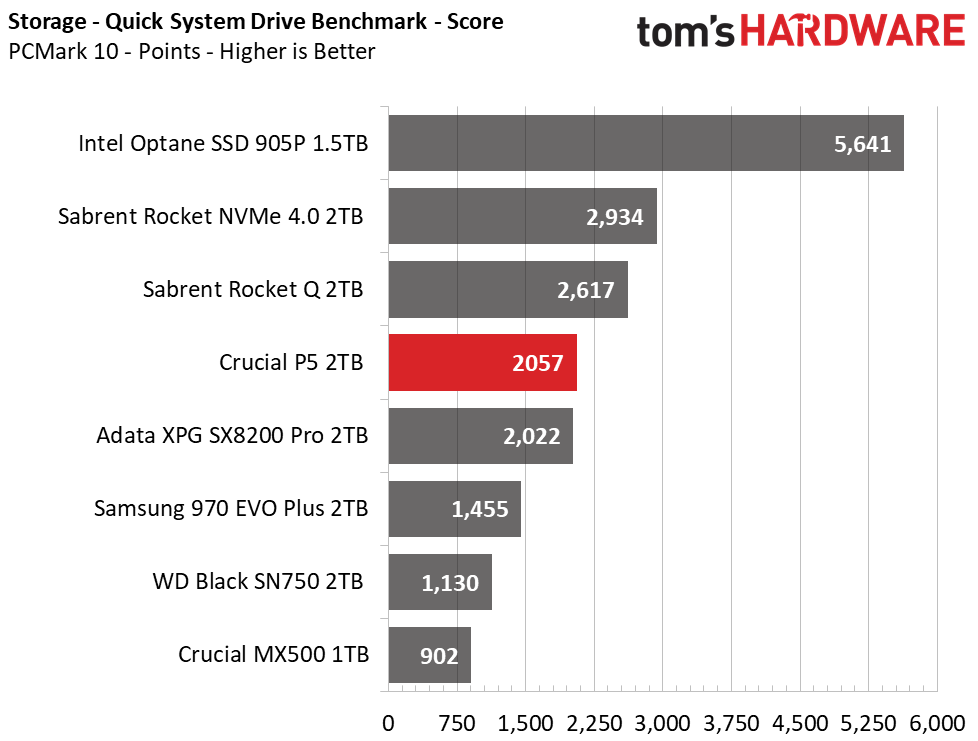

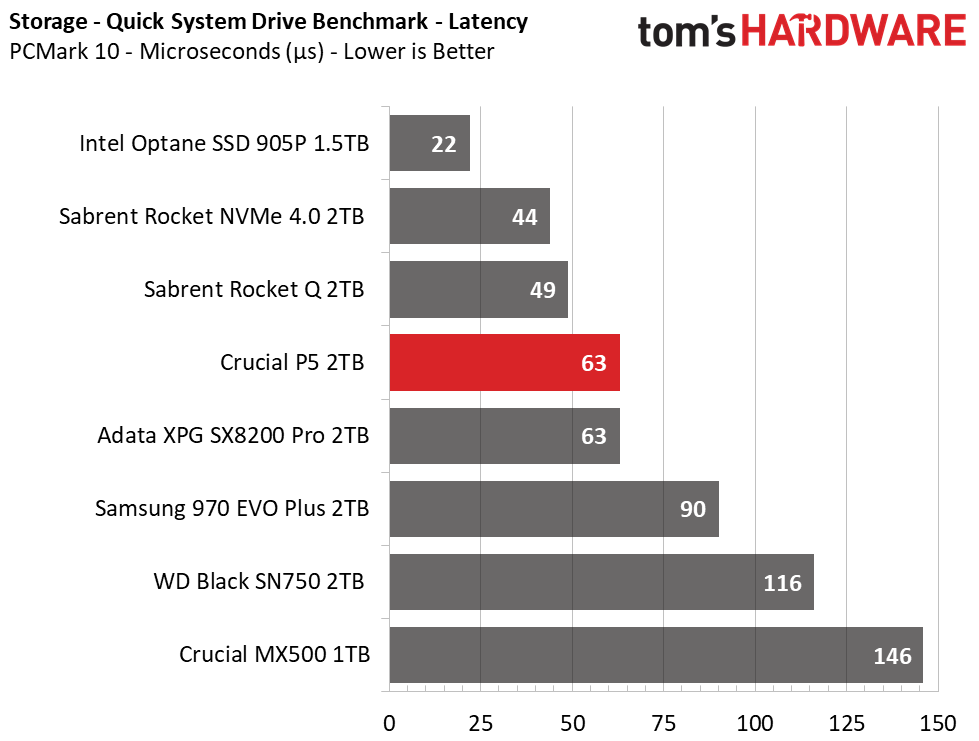
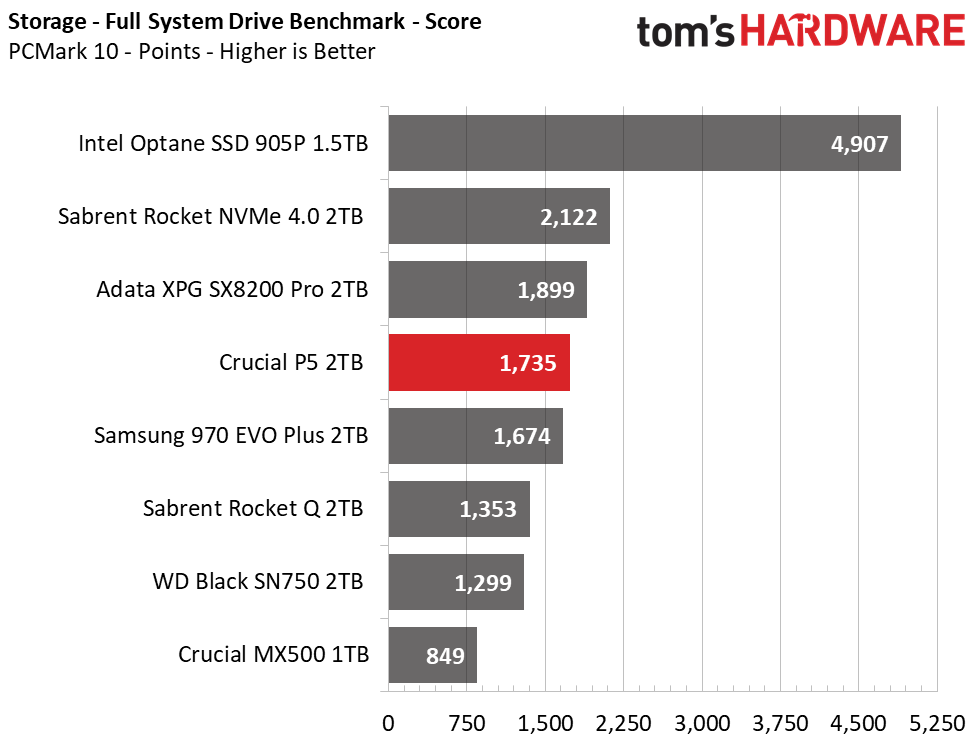
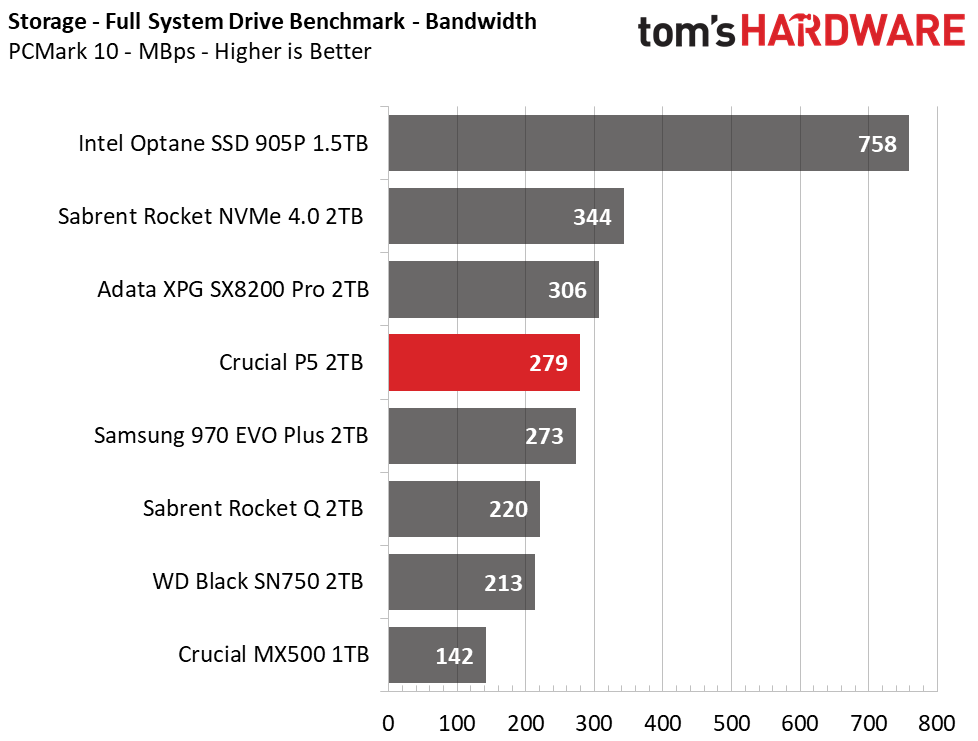
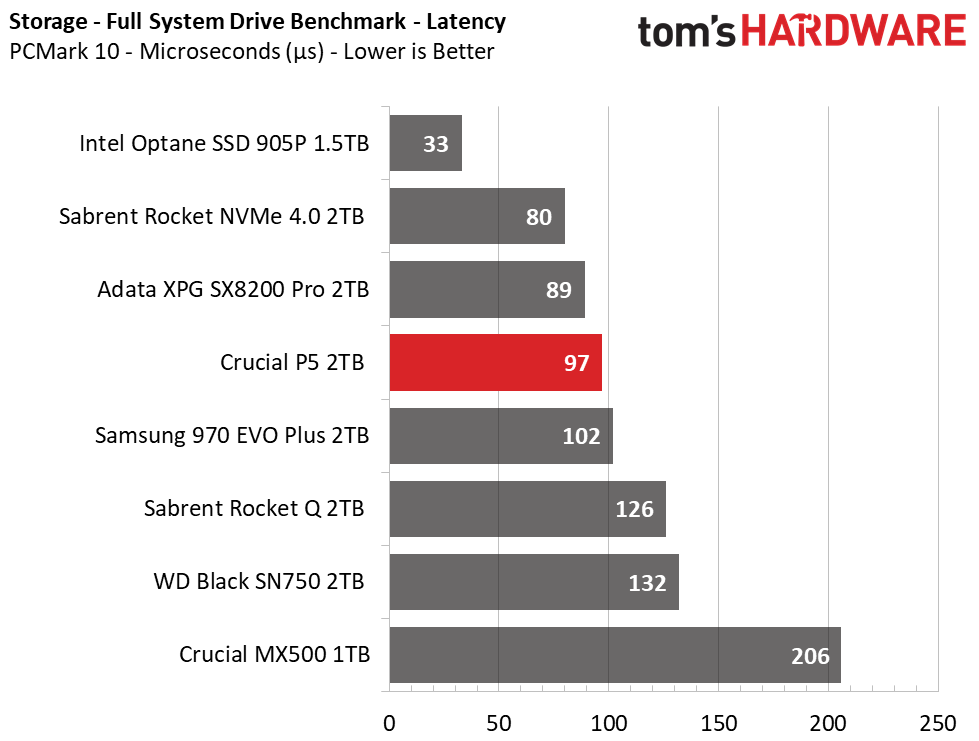
While the Crucial P5 didn't do so well with all the random files we threw at it in the copy tests, it performed adequately during PCMark 10's light and moderate workloads. The drive landed in fourth place in each test, outperforming the Samsung 970 EVO Plus, WD Black SN750, and Rocket Q. Due to the Adata XPG SX8200 Pro’s blistering speed in random workloads, it took the lead over the P5.
Get Tom's Hardware's best news and in-depth reviews, straight to your inbox.
Trace Testing – SPECworkstation 3
Like PCMark 10, SPECworkstation 3 is a trace-based benchmark, but it is designed to push the system harder by measuring workstation performance in professional applications.
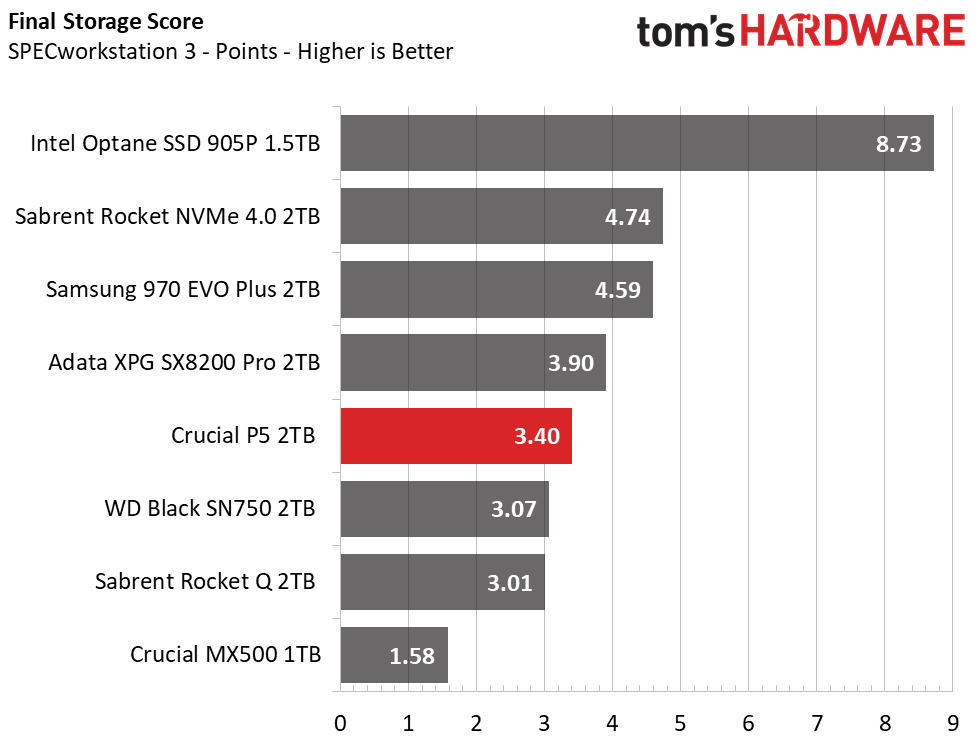
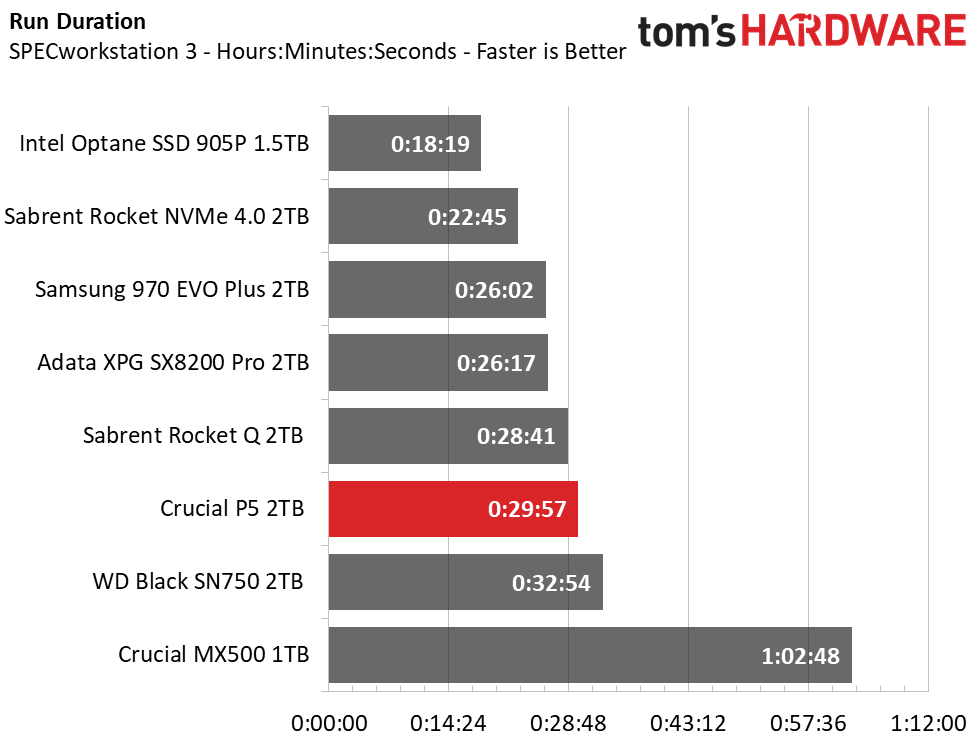
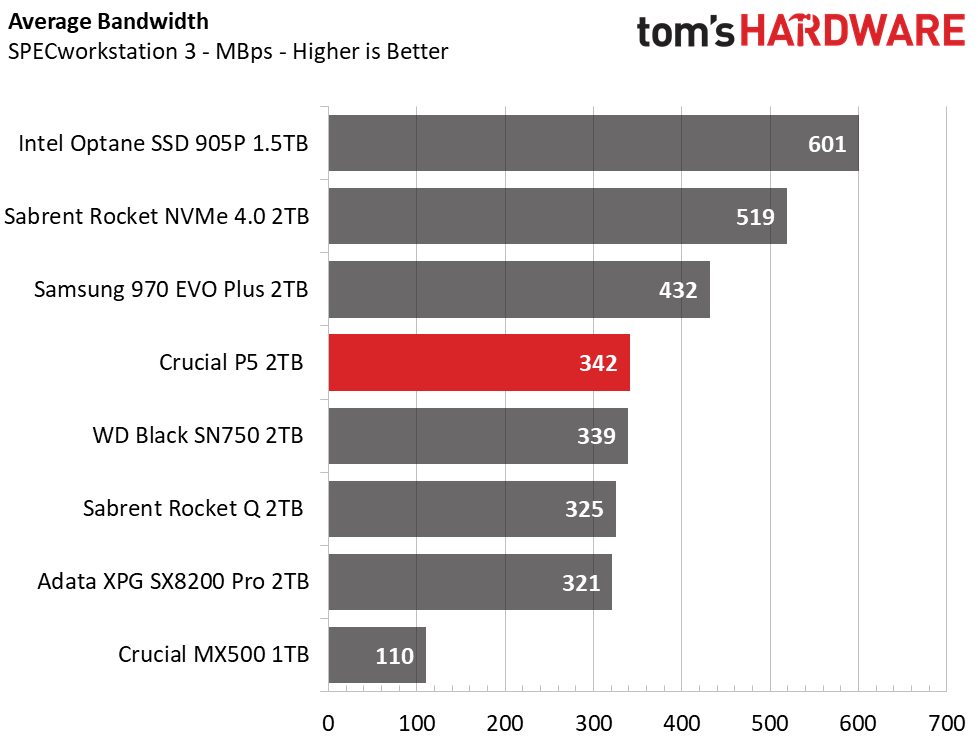
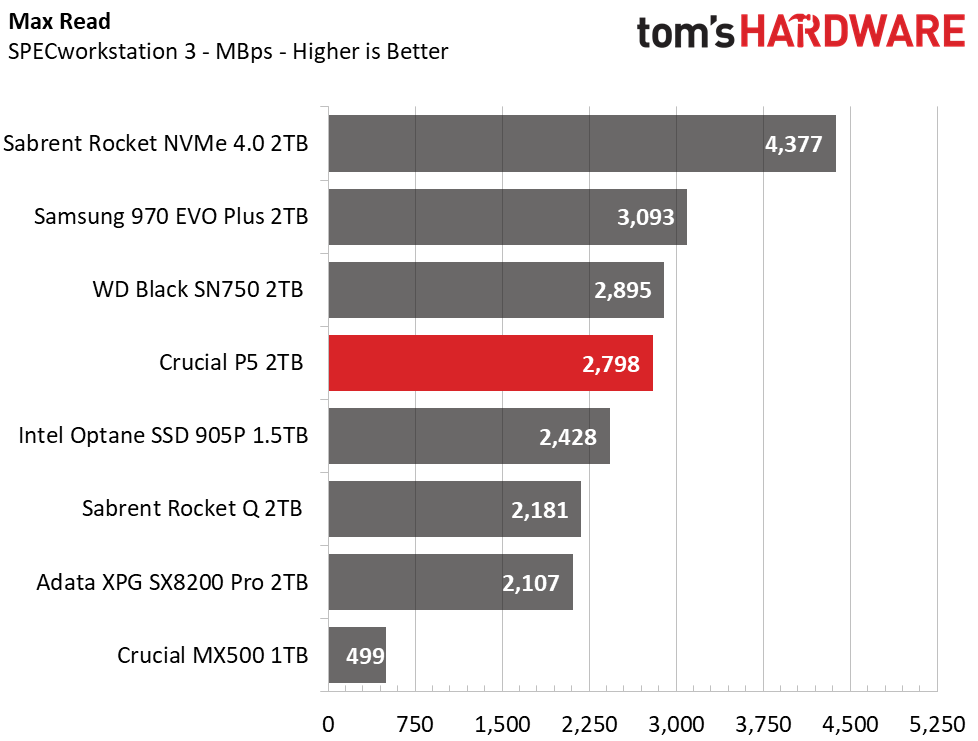
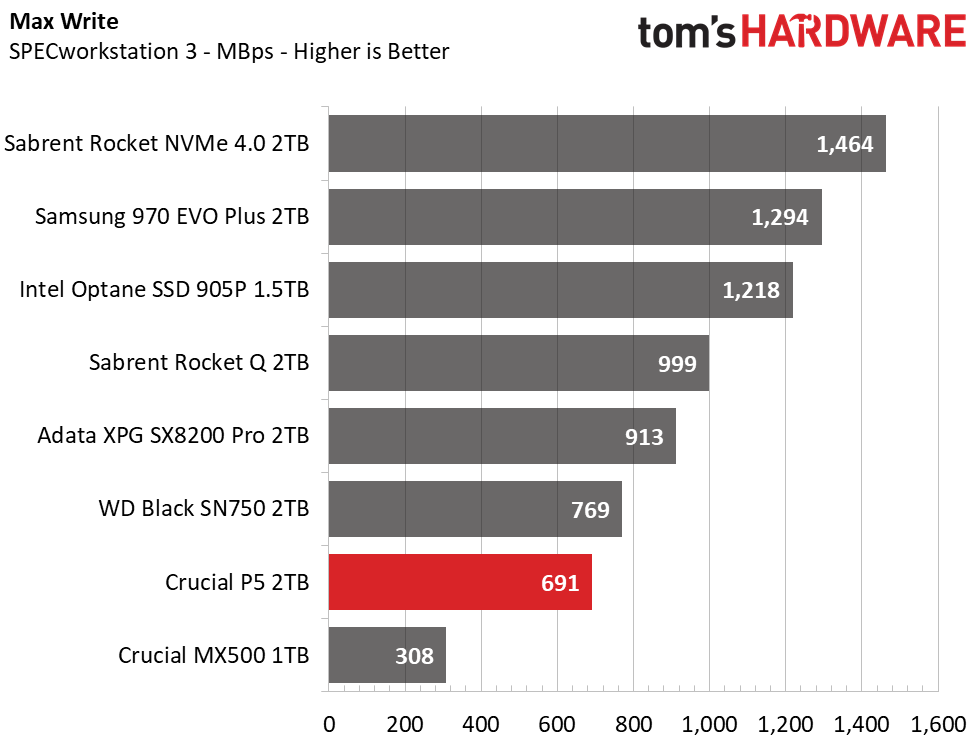
Crucial’s P5 is a decent pick for prosumer workloads, but it isn’t nearly as fast as the Intel Optane 905P or Sabrent Rocket NVMe 4.0. Still, the Crucial P5 outpaces the WD Black SN750 by a few minutes in this test. The QLC Sabrent Rocket Q, however, managed to keep up quite well in most workloads.
Adata’s XPG SX8200 Pro may be more responsive than the P5, but with a slow-to-recover cache, it can’t handle successive extended workloads as well as the Samsung 970 EVO Plus or P5.
Synthetic Testing - ATTO / iometer
iometer is an advanced and highly configurable storage benchmarking tool, while ATTO is a simple and free application that SSD makers commonly use to assign sequential performance specifications to their products. Both of these tools give us insight into how the device handles different file sizes.
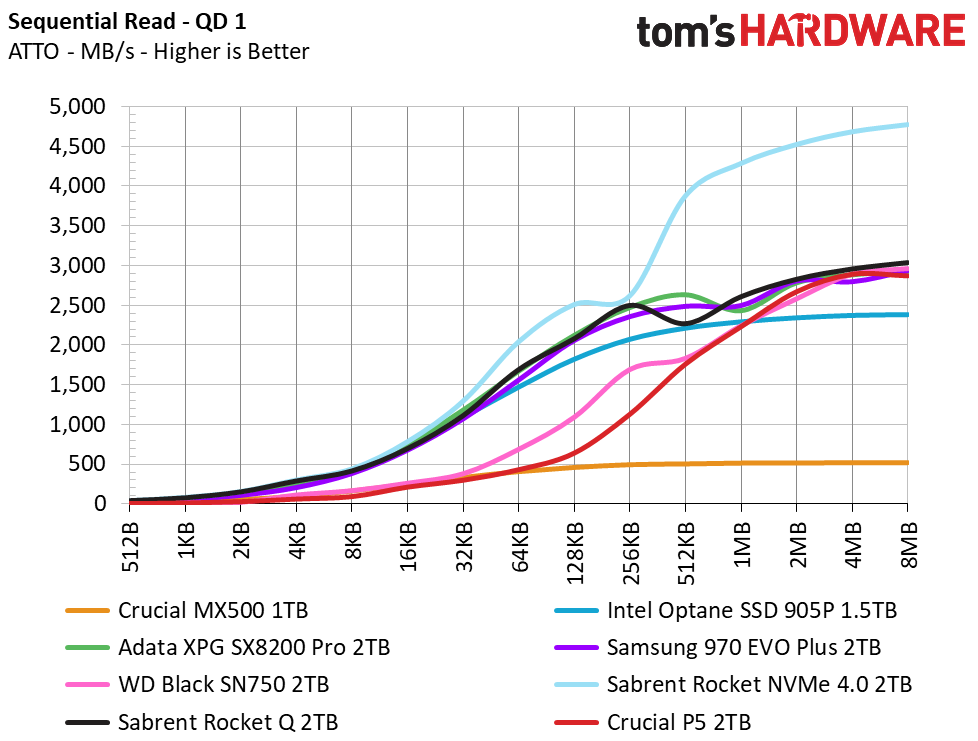
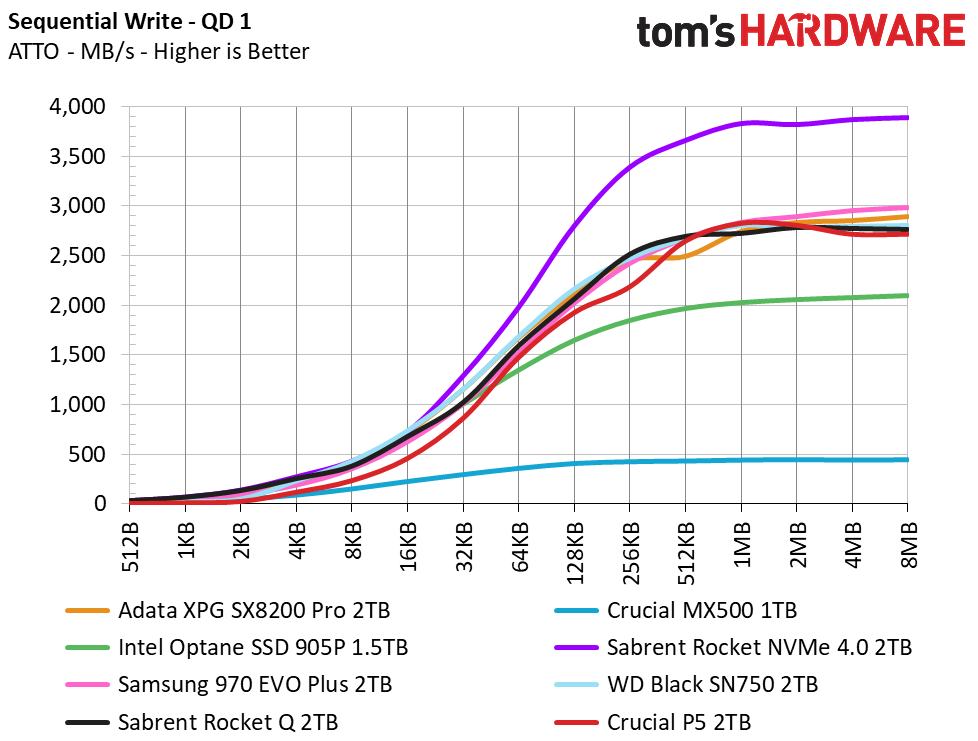
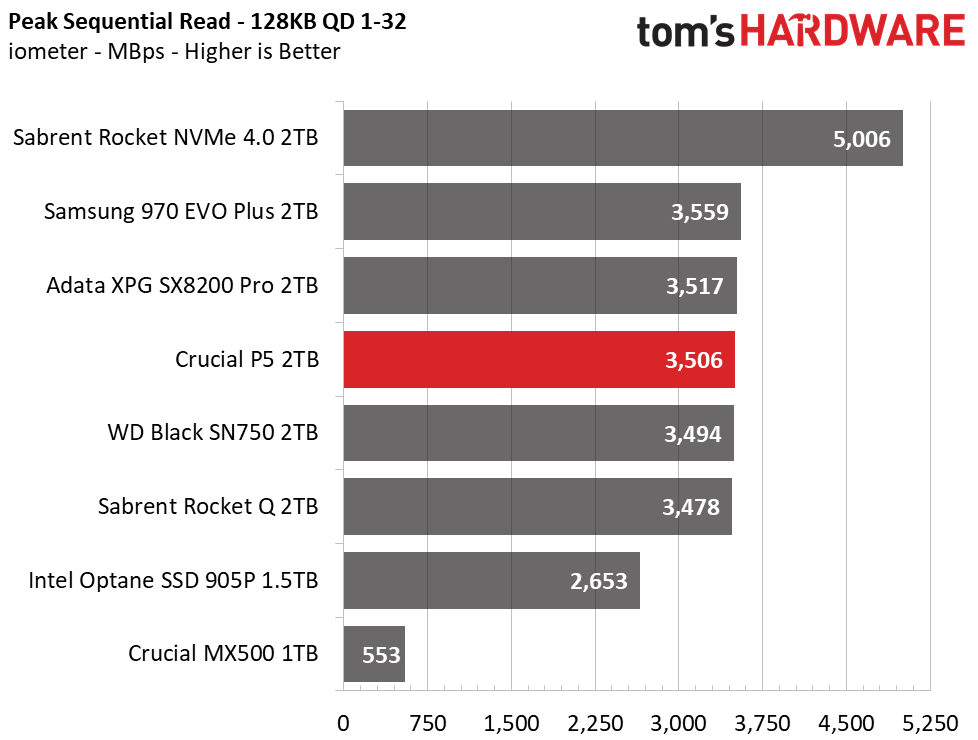
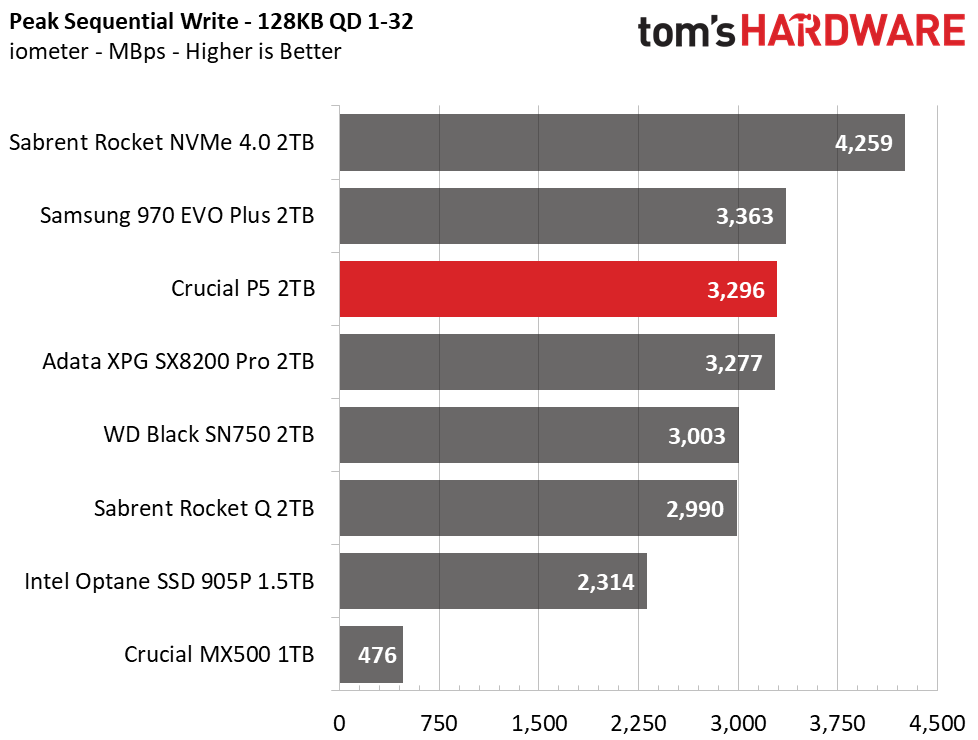
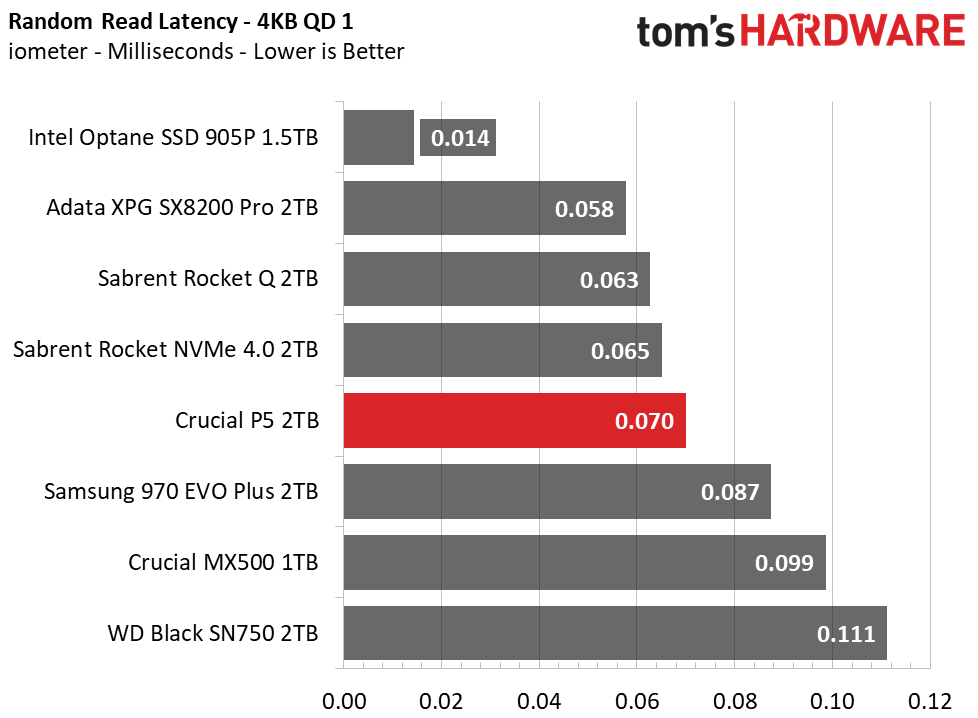
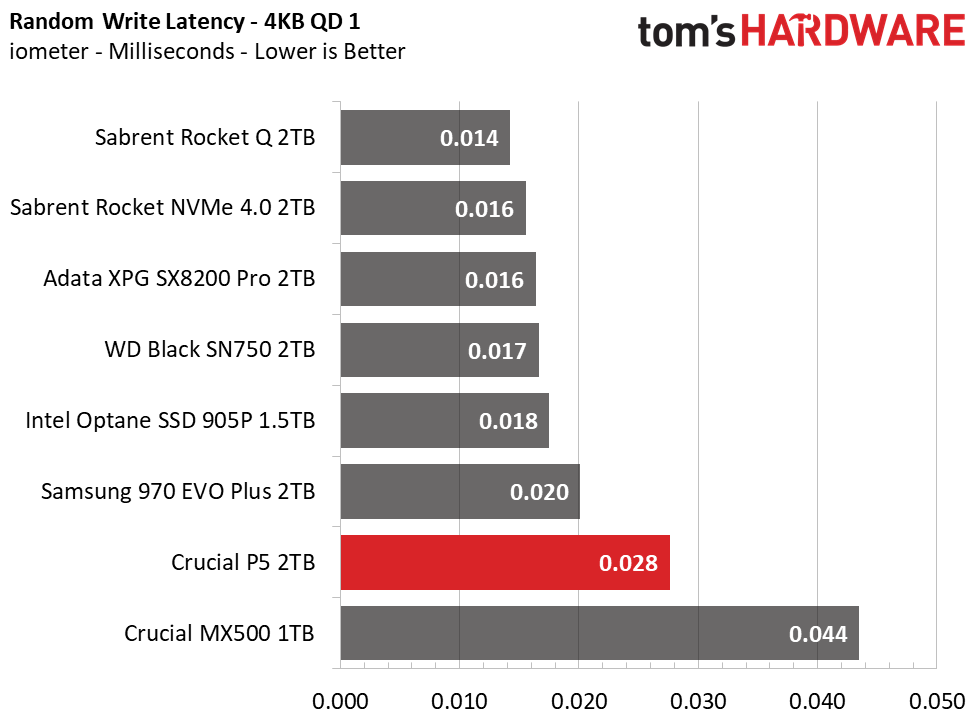
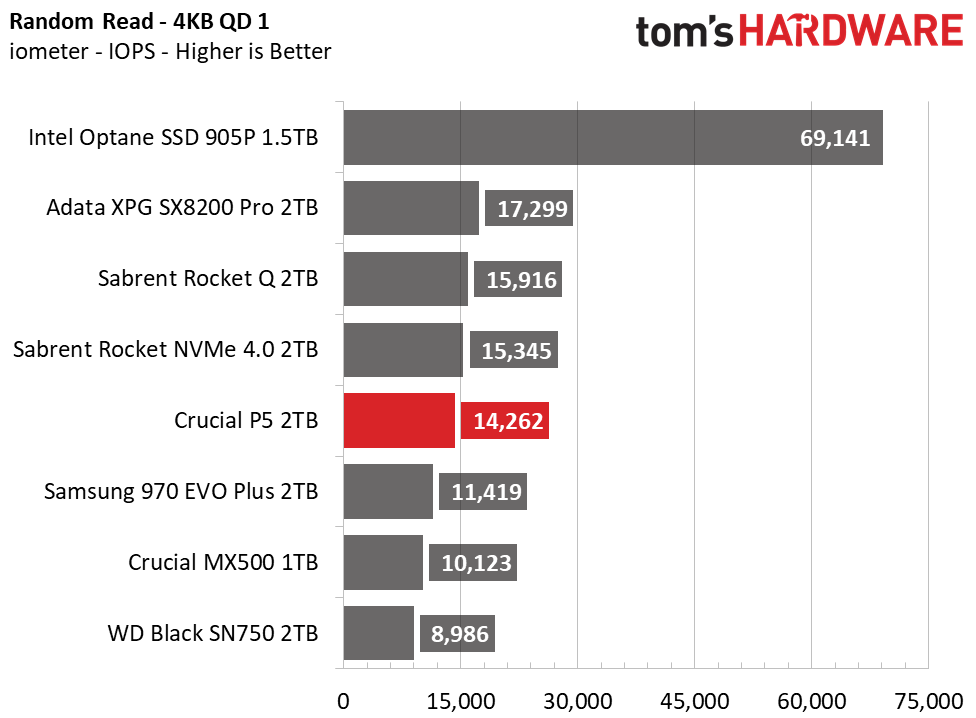

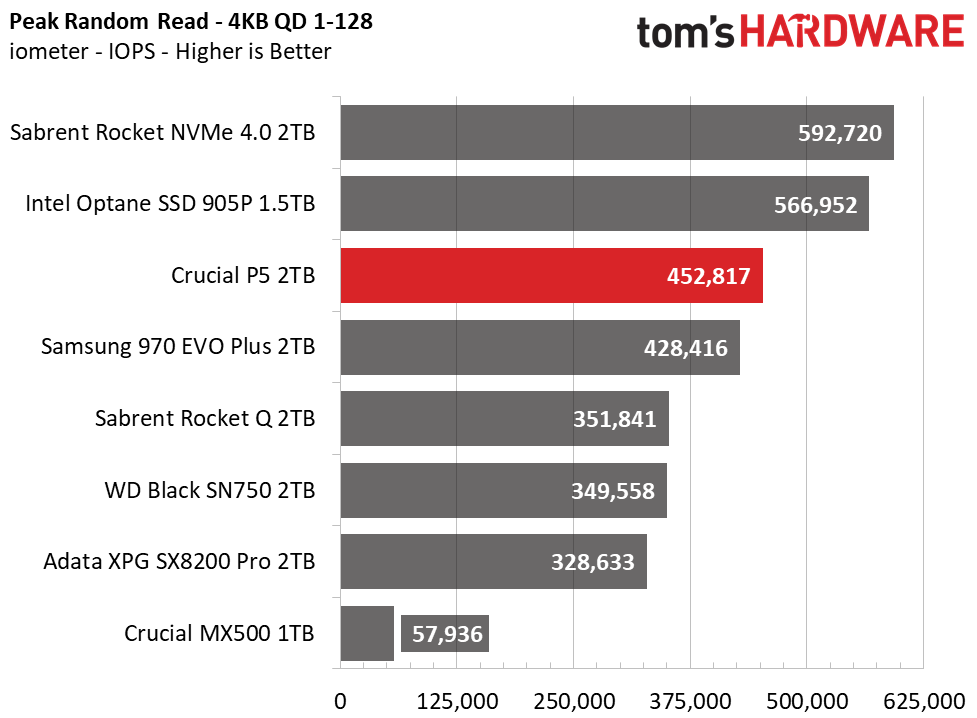
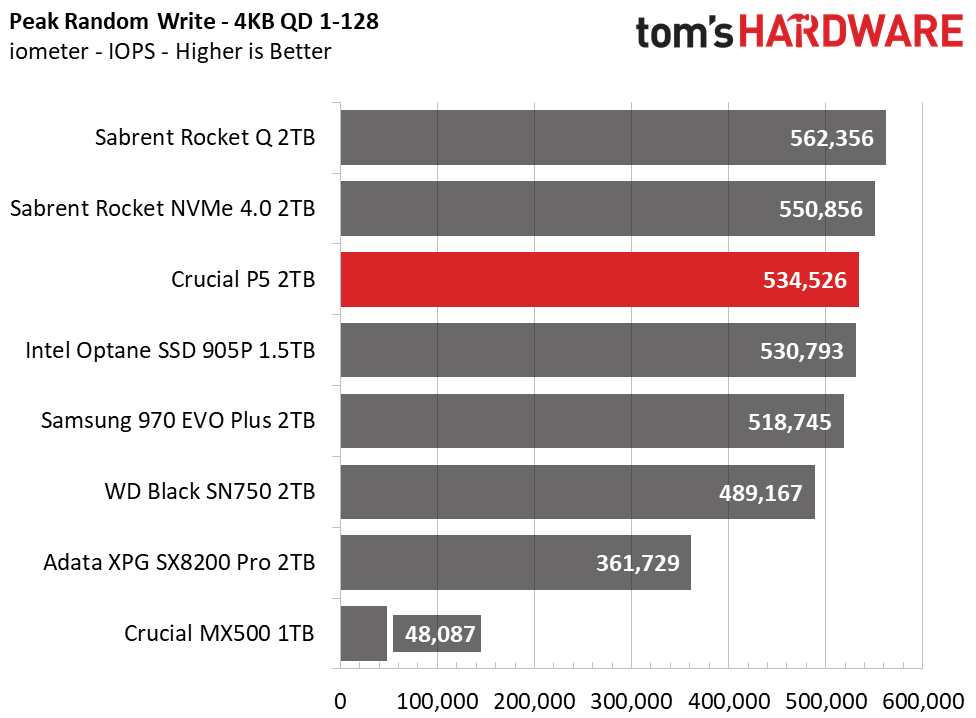
We tested Crucial’s P5 at a QD (queue depth) of 1, representing most day to day file access at various block sizes. The P5’s overall write performance looks good, but it lagged behind even the WD Black SN750 during read workloads. Crucial’s multi-core design seems to be a liability here because while the SSD can deliver fast sequential performance at larger block sizes, it suffers at smaller block sizes - especially with write workloads.
After intensifying the workload, the P5’s sequential performance peaks at 3.5/3.3 GBps read/write. The P5’s performance in random workloads is the polar opposite of the trends we see in our sequential tests. The P5’s random read performance is fast at QD1, while its performance in random write tests is much slower than the competition.
Sustained Write Performance and Cache Recovery
Official write specifications are only part of the performance picture. Most SSDs implement a write cache, which is a fast area of (usually) pseudo-SLC programmed flash that absorbs incoming data. Sustained write speeds can suffer tremendously once the workload spills outside of the cache and into the "native" TLC or QLC flash. We use iometer to hammer the SSD with sequential writes for 15 minutes to measure both the size of the write cache and performance after the cache is saturated. We also monitor cache recovery via multiple idle rounds.
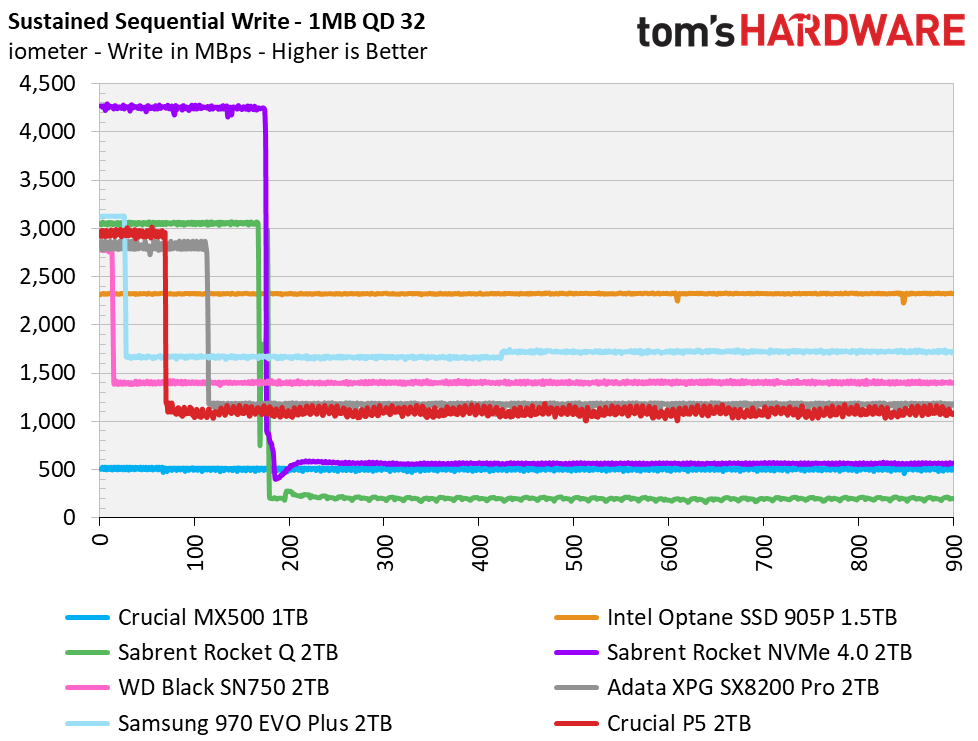
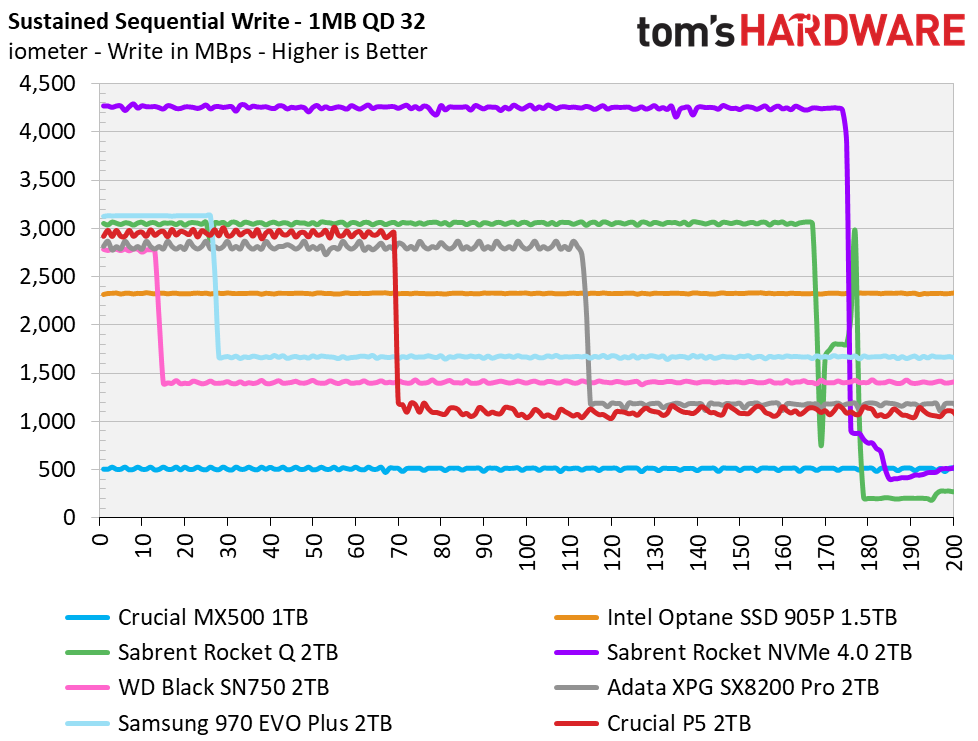
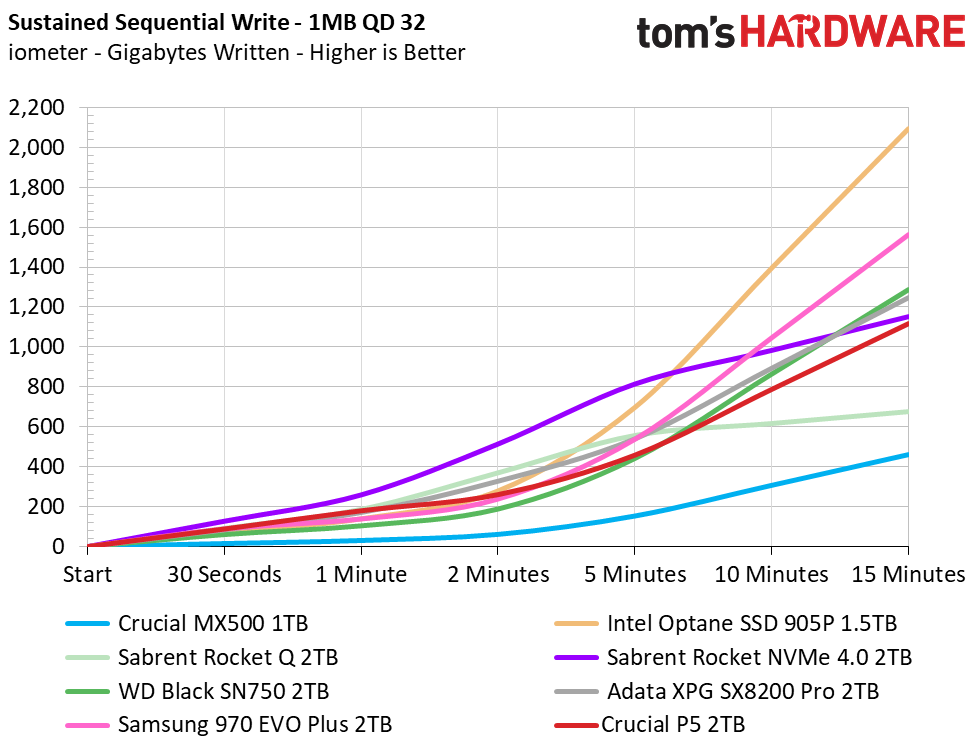
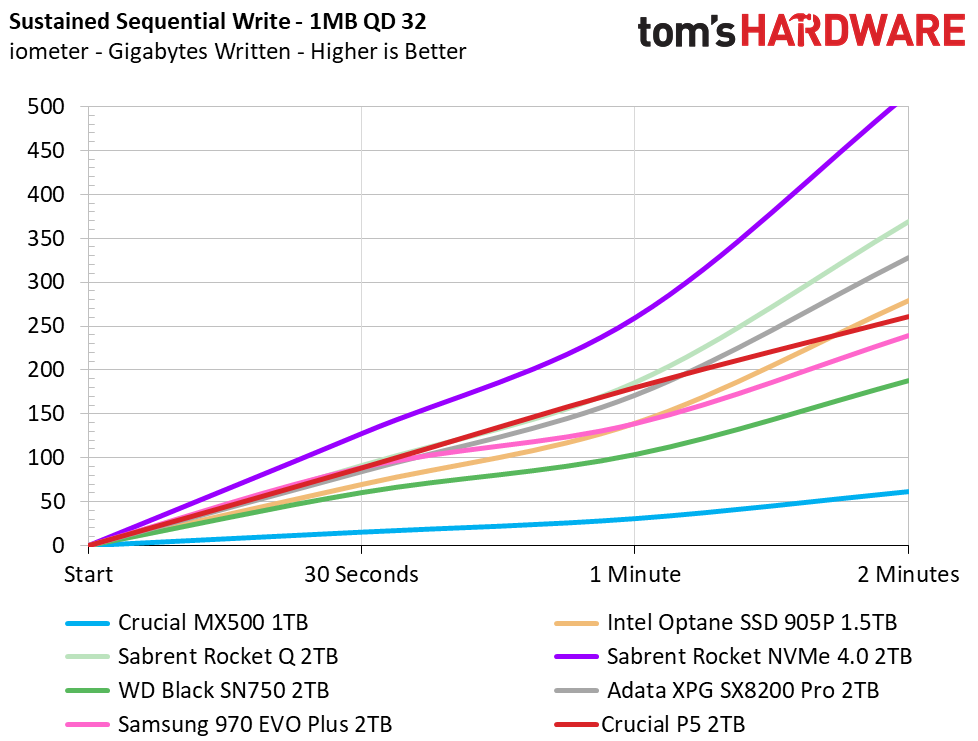
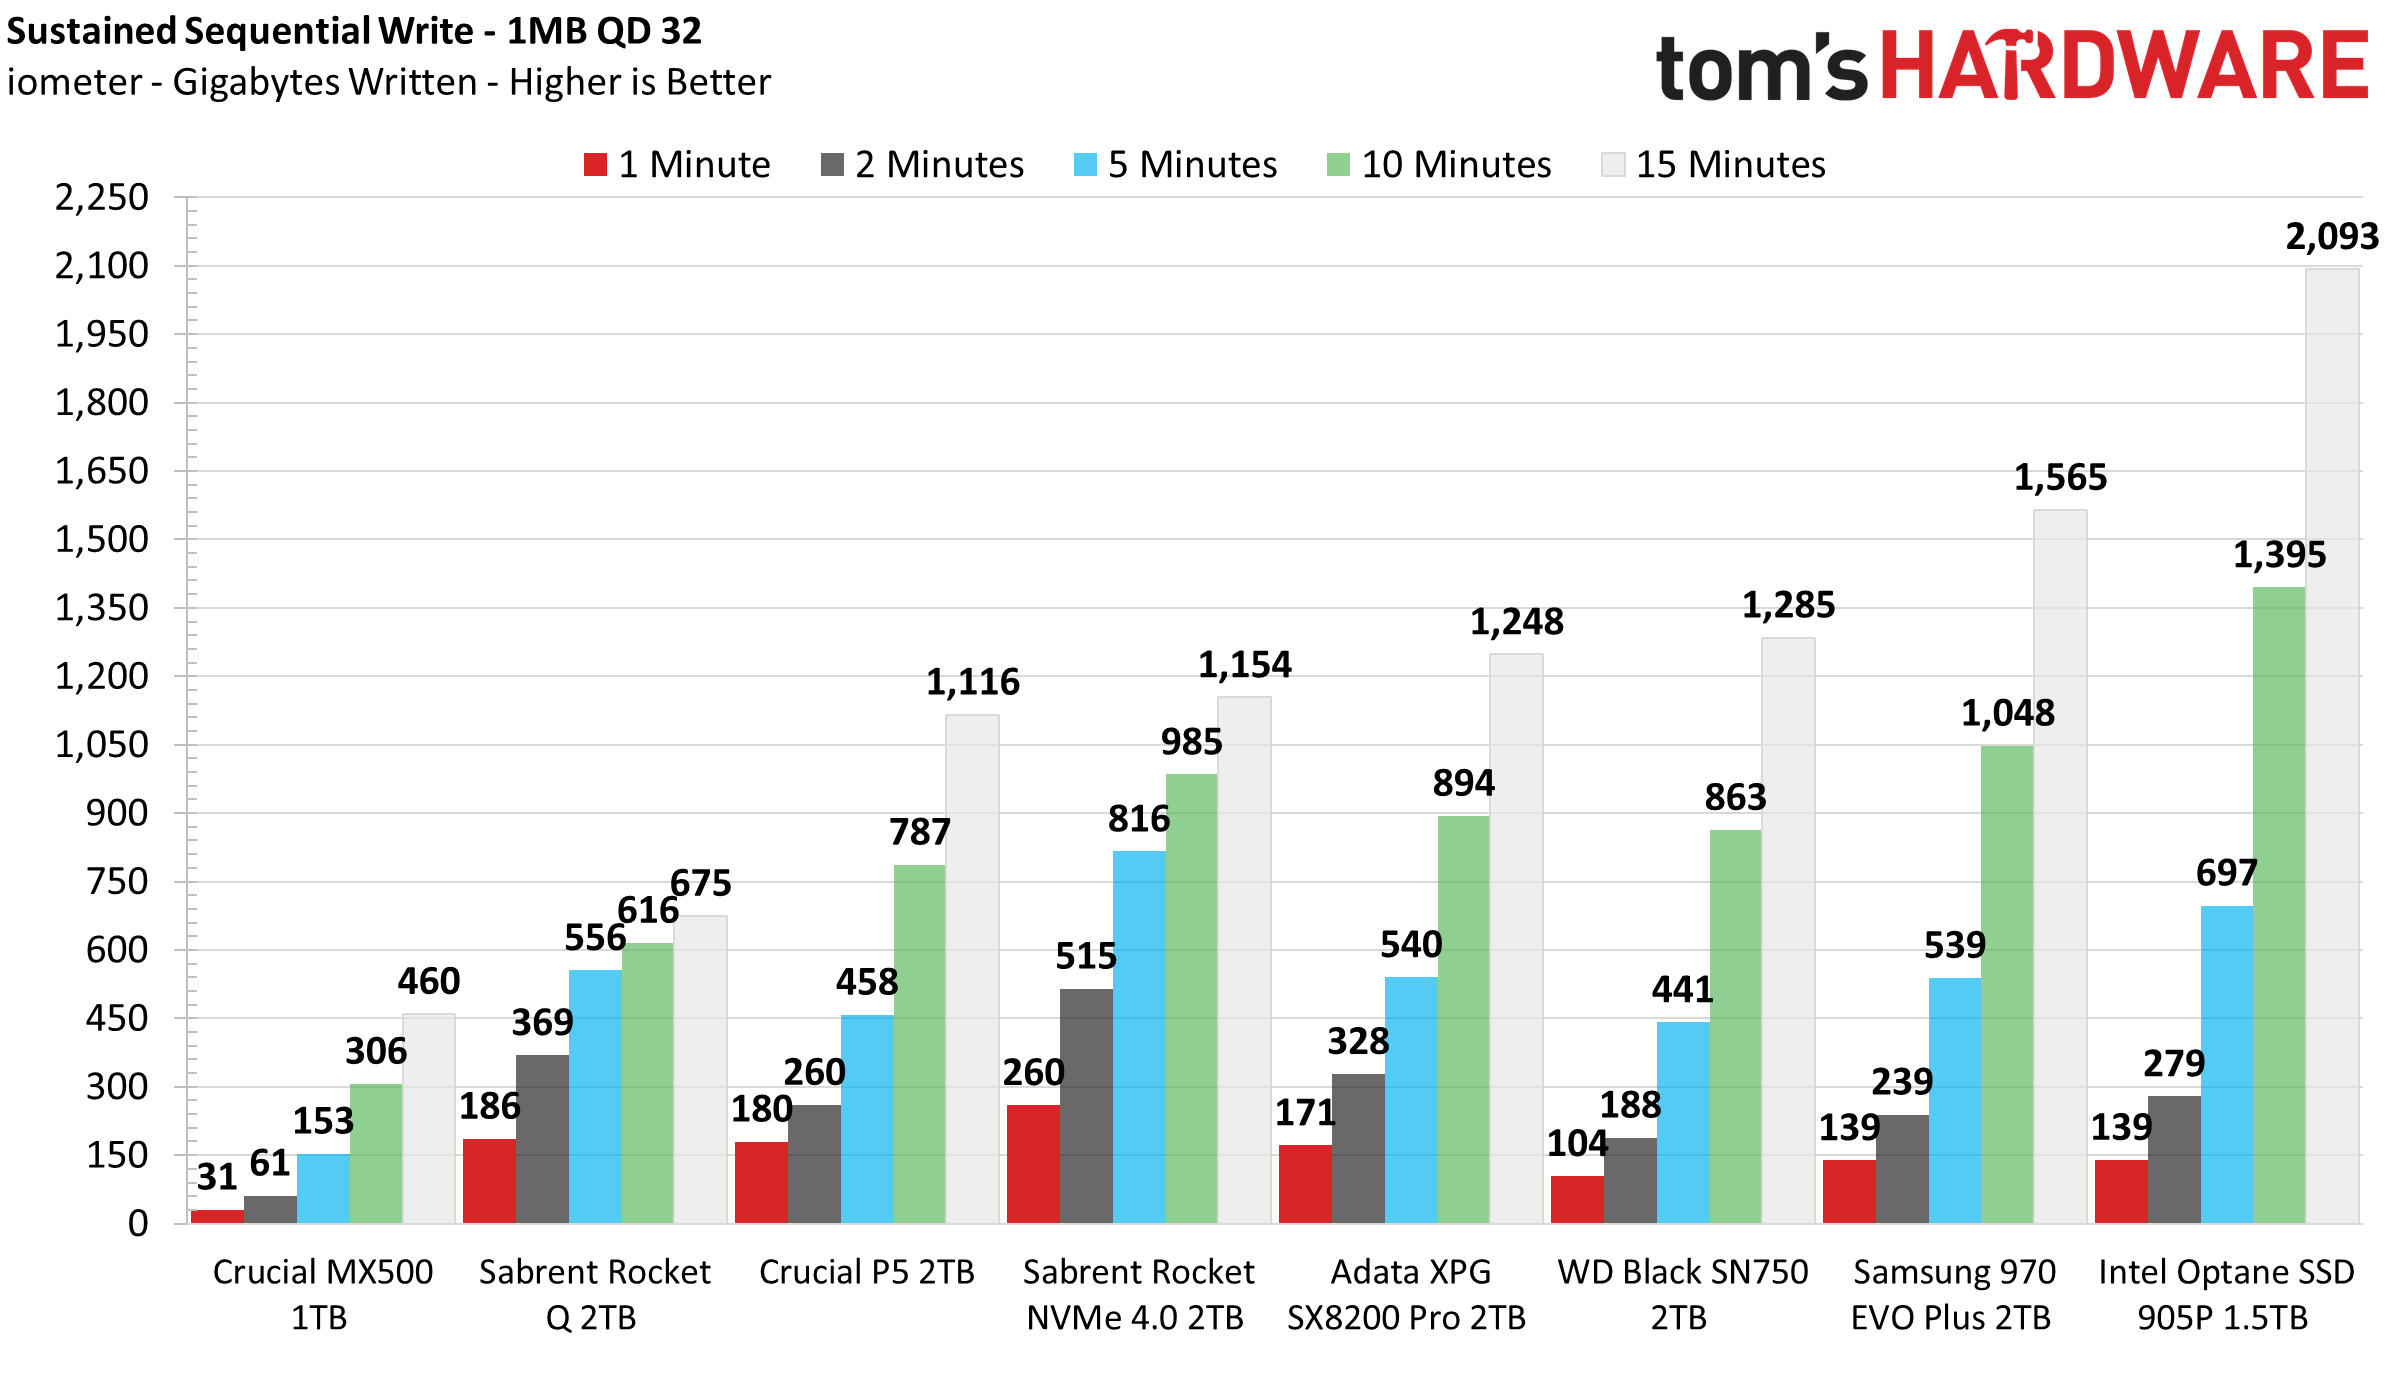
The Crucial P5 wrote roughly 200GB of data at 3GBps before degrading to a speed of 1,100 MBps.
Like the 1TB model, the 2TB Crucial P5 has rather unusual write performance characteristics, largely because it comes with one of the most interesting caching mechanisms we've seen.
Some SSDs recover only 4-6GB of SLC cache within a few moments, and then take hours to recover the rest of the cache capacity. In contrast, other SSDs will immediately recover all of the cache as fast as possible, and at a fairly steady rate.
Crucial, however, can recoup its entire cache immediately after a write transfer stops, and the cache also expands when it detects a large sequential workload. This means that while the initial fill shows that the SLC cache is only about 200GB, we measured 350GB after 30 seconds of idle time. After an additional minute of idle time, the SLC cache grew to 500GB.
Power Consumption and Temperature
We use the Quarch HD Programmable Power Module to gain a deeper understanding of power characteristics. Idle power consumption is an important aspect to consider, especially if you're looking for a laptop upgrade. Some SSDs can consume watts of power at idle while better-suited ones sip just milliwatts. Average workload power consumption and max consumption are two other aspects of power consumption, but performance-per-watt is more important. A drive might consume more power during any given workload, but accomplishing a task faster allows the drive to drop into an idle state faster, which ultimately saves power.
We also monitor the temperature of the drive via the S.M.A.R.T. data and an IR thermometer to see when (or if) thermal throttling kicks in and how it impacts performance. Bear in mind that results will vary based on the workload and ambient air temperature.
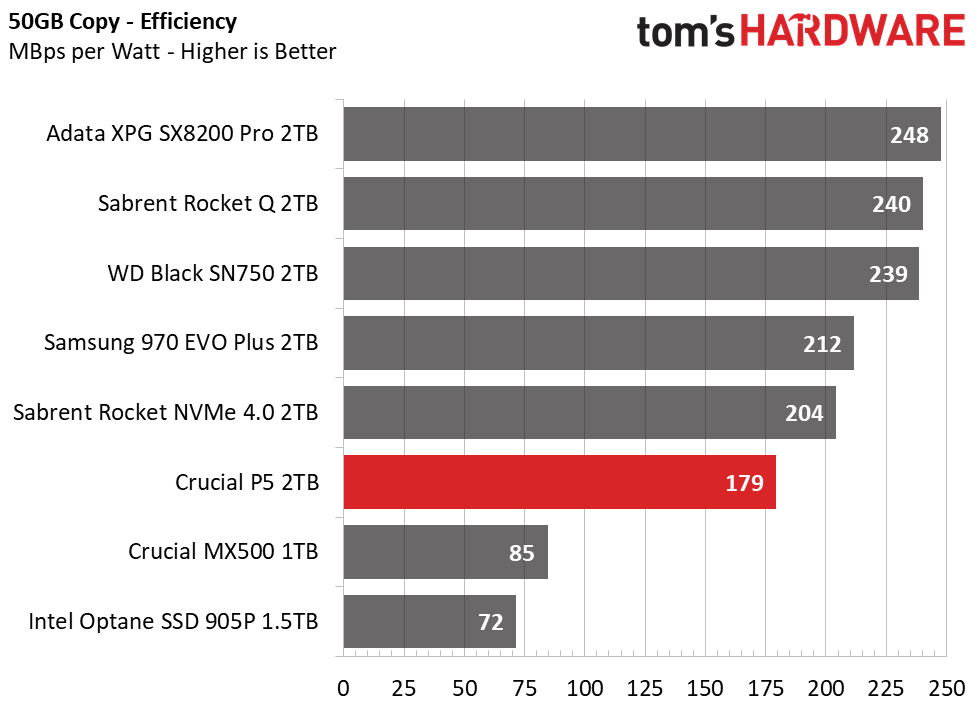
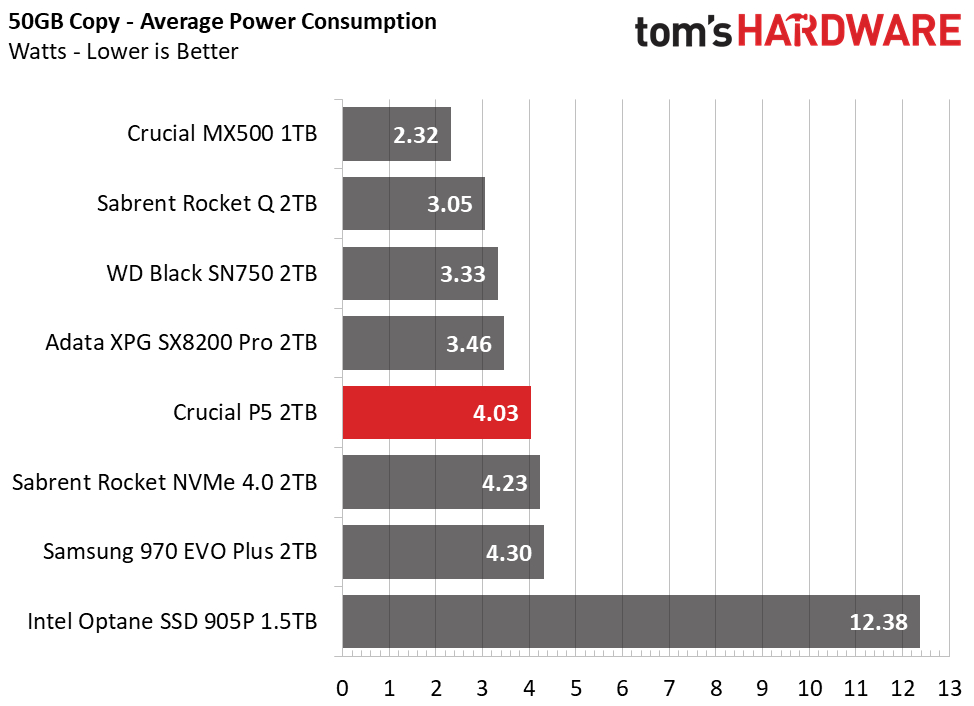
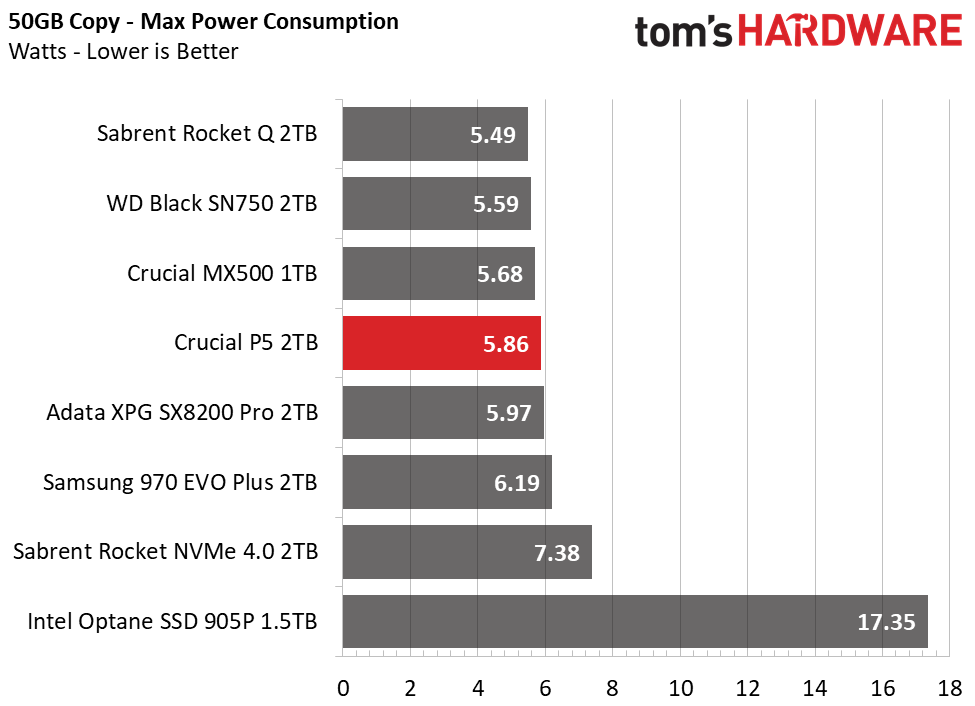
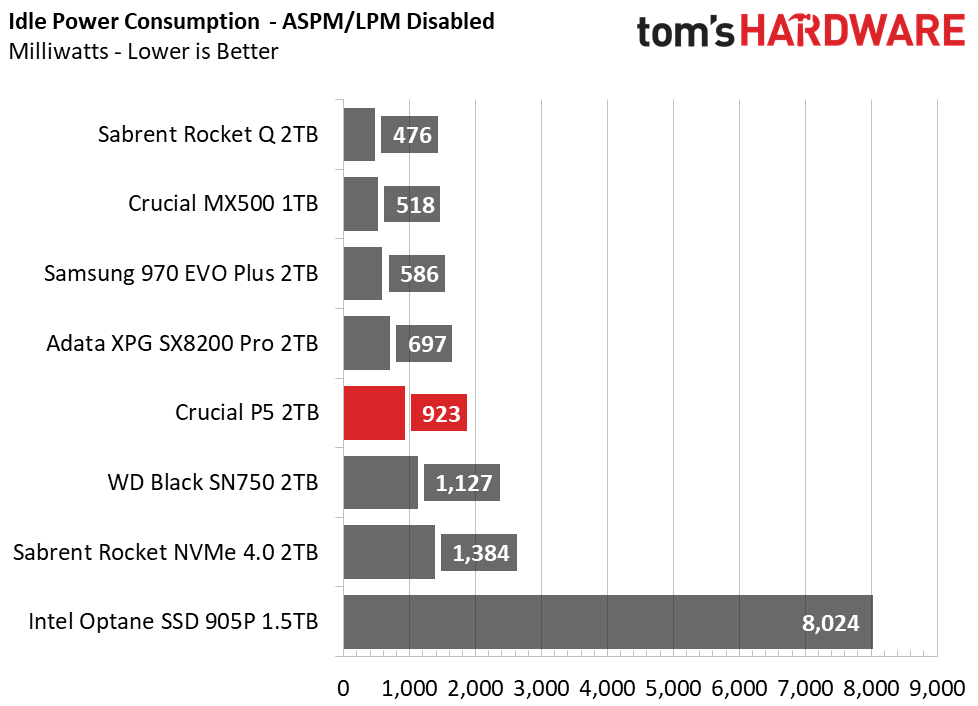
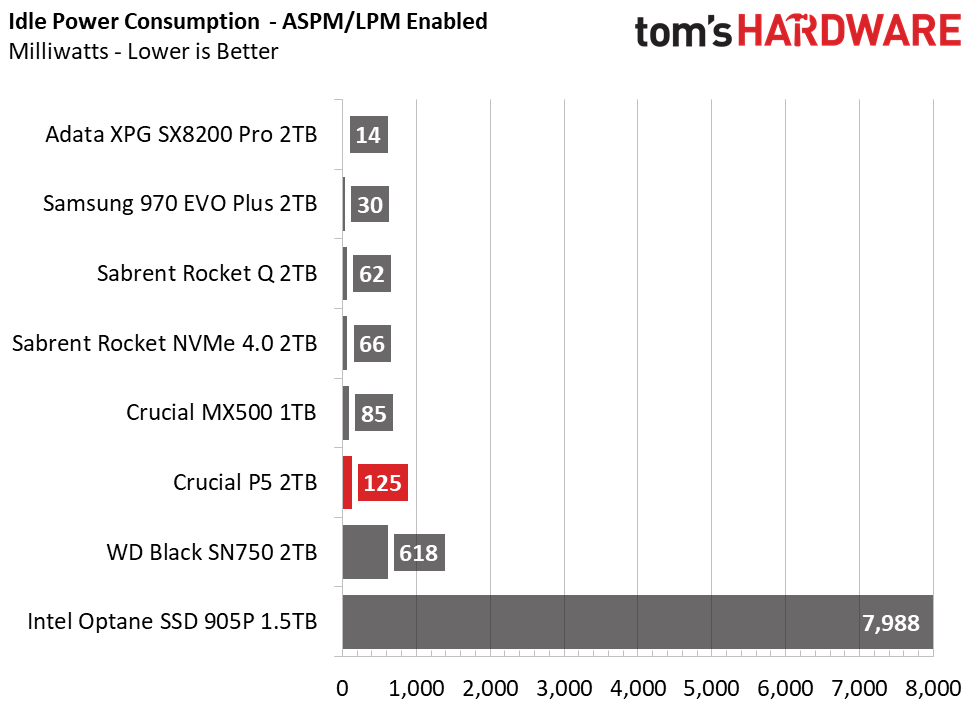
The P5 regulates its average and peak power consumption well, but the drives' somewhat weak file copy performance hurts its power efficiency score. Placing third to last place, the P5 is twice as efficient as a SATA SSD but isn't up to par with the competition. Idle power consumption is a little high, too, probably because the controller has six cores. This is the company's first implementation so there's room for improvement, which usually comes from firmware tuning as a design matures.
The P5 runs hot. At idle, the Crucial P5's controller hovers around 50C. That's 10-15C higher than most M.2 NVMe SSDs. After we threw a few 50GB and 100GB file transfers its way, the P5 heated up and ultimately throttled. The controller measured 94C, while the SMART data reported upwards of 100-103C before the drive finally throttled down to speeds of 200MBps. The NAND temperature on the surface of the package got up to 77C while the DRAM peaked at 74C. If you want to use this in a workstation, be sure to provide additional cooling.
MORE: Best SSDs
MORE: How We Test HDDs And SSDs
MORE: All SSD Content
Current page: 2TB Performance Results
Prev Page Features and Specifications Next Page 1TB Performance Results
Sean is a Contributing Editor at Tom’s Hardware US, covering storage hardware.
-
Co BIY Should the 2T model perform better because of greater parallelism with the additional NAND packages ?Reply
Also why is the $/Gig greater at 2T than at 1T? Seems unusual. -
Co BIY I think it would be worth while to run the 1TB version vs the 2TB by placing each as a competitor into the others review heat. That way we not only see how it compares to the same size competition but how they stack up head to head.Reply
Then you can see the choices easily - The drive against the competitors and against itself.
and you get to publish hard earned data twice for more views! -
Avro Arrow From what I've seen, nothing beats the Corsair Force NVMe drive. It has a read/write rating of 4950MBps/4950MBps. Of course, it only gets those speeds with PCI-Express 4.0 so ATM only AMD can really take advantage of it.Reply -
JonnyDough ReplyAvro Arrow said:From what I've seen, nothing beats the Corsair Force NVMe drive. It has a read/write rating of 4950MBps/4950MBps. Of course, it only gets those speeds with PCI-Express 4.0 so ATM only AMD can really take advantage of it.
That may be so for sequential but the Force series does not have the highest random read/write speeds out there... -
seanwebster Reply
That's a good idea, but can get tricky. I wish we could simply update a database for easy to make charts. I will try to include the next closest capacity in with the updated capacity under test, though.Co BIY said:I think it would be worth while to run the 1TB version vs the 2TB by placing each as a competitor into the others review heat. That way we not only see how it compares to the same size competition but how they stack up head to head.
Then you can see the choices easily - The drive against the competitors and against itself.
and you get to publish hard earned data twice for more views!
Well, the 1TB Seagate FireCuda 520 and the 2TB Sabrent Rocket NVMe 4.0 are identical to the Corsair Force MP600, so they all perform the same. You can swap the names for the corsair in the benchmarks above if you want to see how it compares. Samsung's 980 PRO is now out and a few more Gen4 devices are on the way. The Phison PS5016-E16 NVMe controller powering thOse drives is no longer top dog.Avro Arrow said:From what I've seen, nothing beats the Corsair Force NVMe drive. It has a read/write rating of 4950MBps/4950MBps. Of course, it only gets those speeds with PCI-Express 4.0 so ATM only AMD can really take advantage of it. -
Avro Arrow Reply
I believe you. I know that memory is only made by a few companies like Samsung, Hynix and Micron so it would make sense that their top-end products wouldn't just go to Corsair. The Team T-Force CARDEA is pretty close too with theoretical read/write limits of 5000/4400.seanwebster said:That's a good idea, but can get tricky. I wish we could simply update a database for easy to make charts. I will try to include the next closest capacity in with the updated capacity under test, though.
Well, the 1TB Seagate FireCuda 520 and the 2TB Sabrent Rocket NVMe 4.0 are identical to the Corsair Force MP600, so they all perform the same. You can swap the names for the corsair in the benchmarks above if you want to see how it compares. Samsung's 980 PRO is now out and a few more Gen4 devices are on the way. The Phison PS5016-E16 NVMe controller powering thOse drives is no longer top dog.
Jeez, these numbers are getting so big that they're starting to lose all meaning! :D
