Enermax Revolution SFX 650W PSU Review
Why you can trust Tom's Hardware
Cross-Load Tests & Infrared Images
Our cross-load tests are described in detail here.
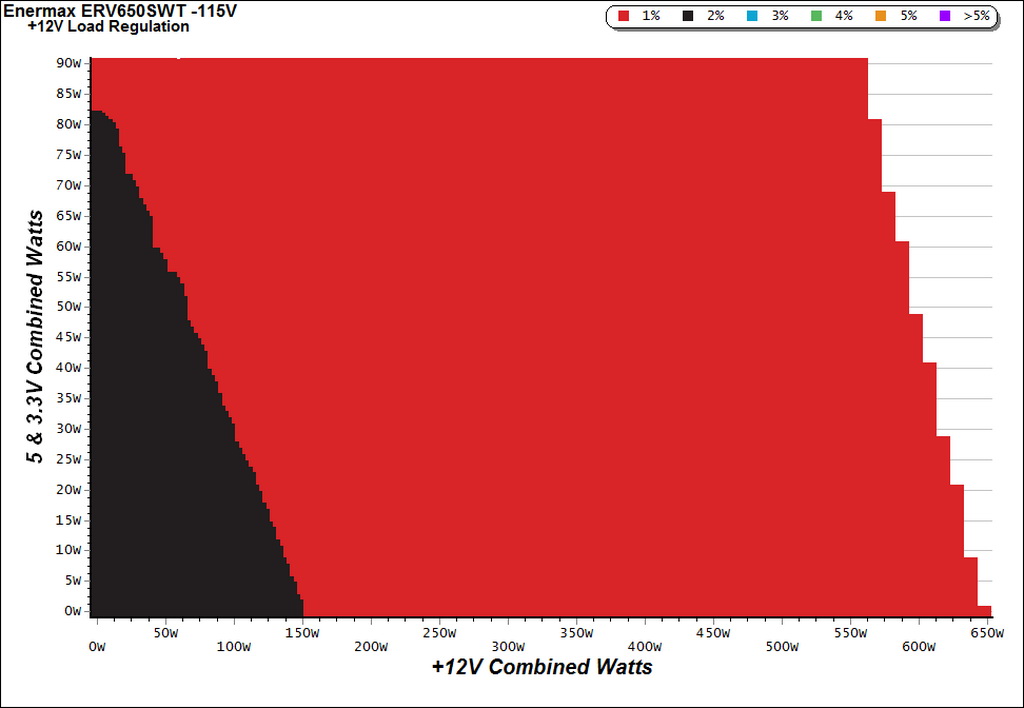
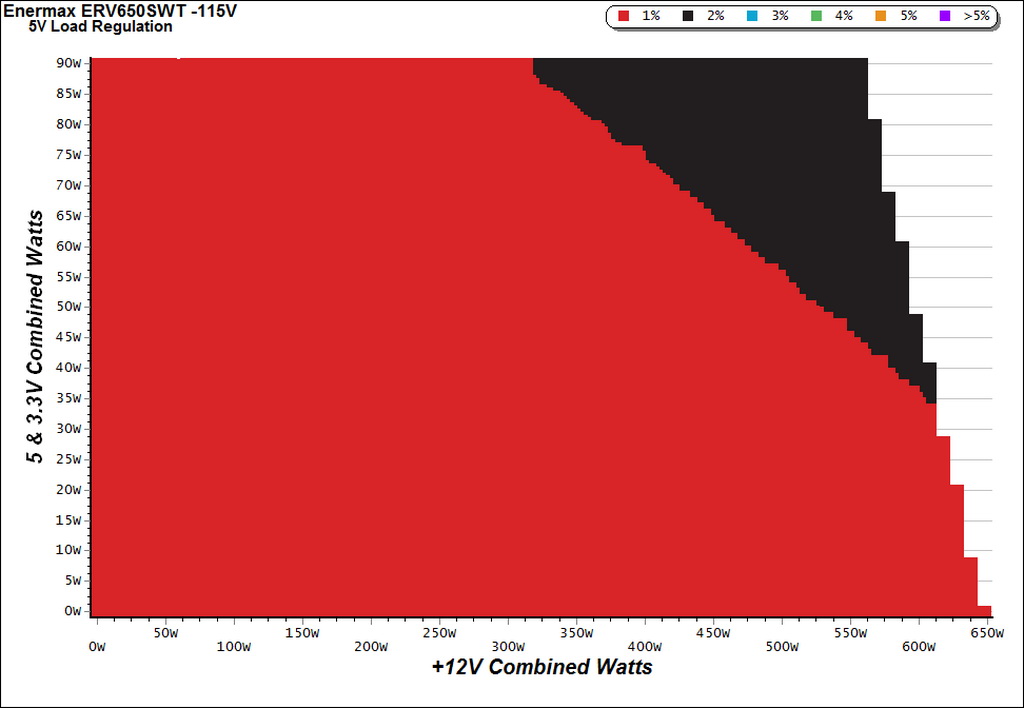
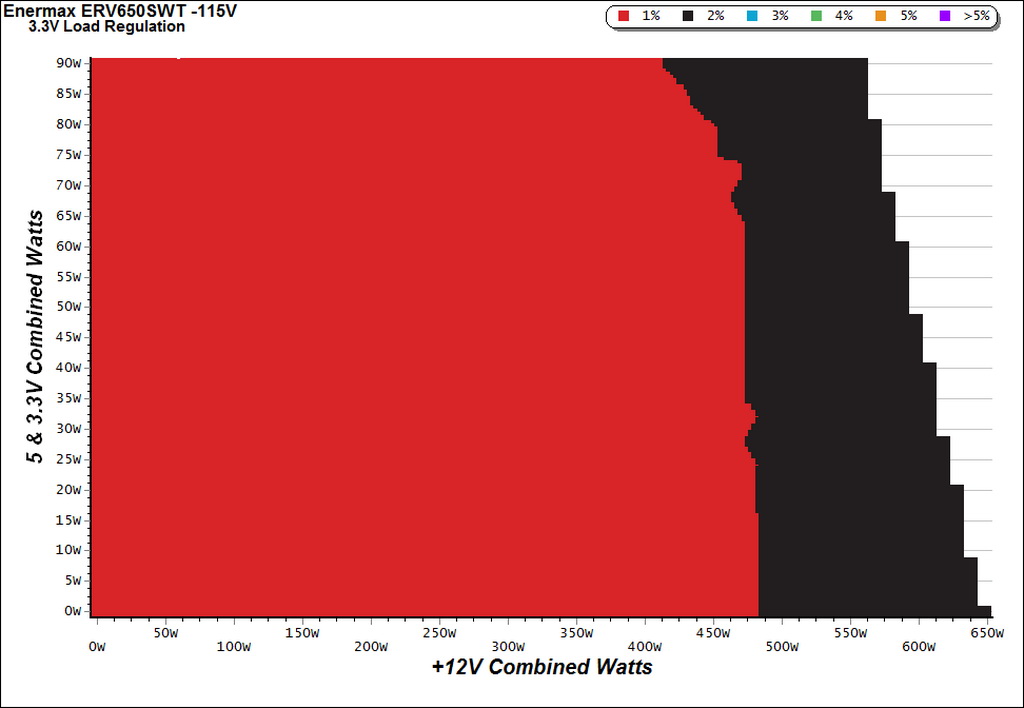
To generate the following charts, we set our loaders to auto mode through our custom-made software before trying more than 25,000 possible load combinations with the +12V, 5V and 3.3V rails. The load regulation deviations in each of the charts below were calculated by taking the nominal values of the rails (12V, 5V and 3.3V) as point zero. The ambient temperature was between at 30°C (86°F) to 32°C (89.6°F).
Load Regulation Charts
Efficiency Chart
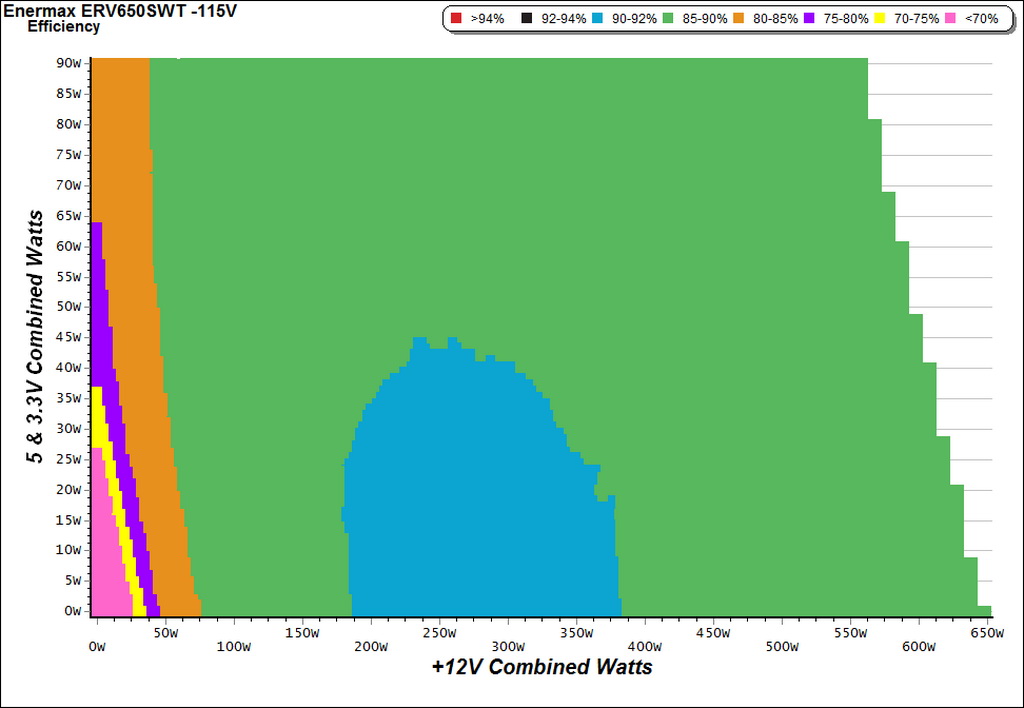
The 90-92% efficiency range in this graph is mid-sized. For most of its operating range, this unit delivers between 85 to 90% efficiency with 115V input.
Ripple Charts
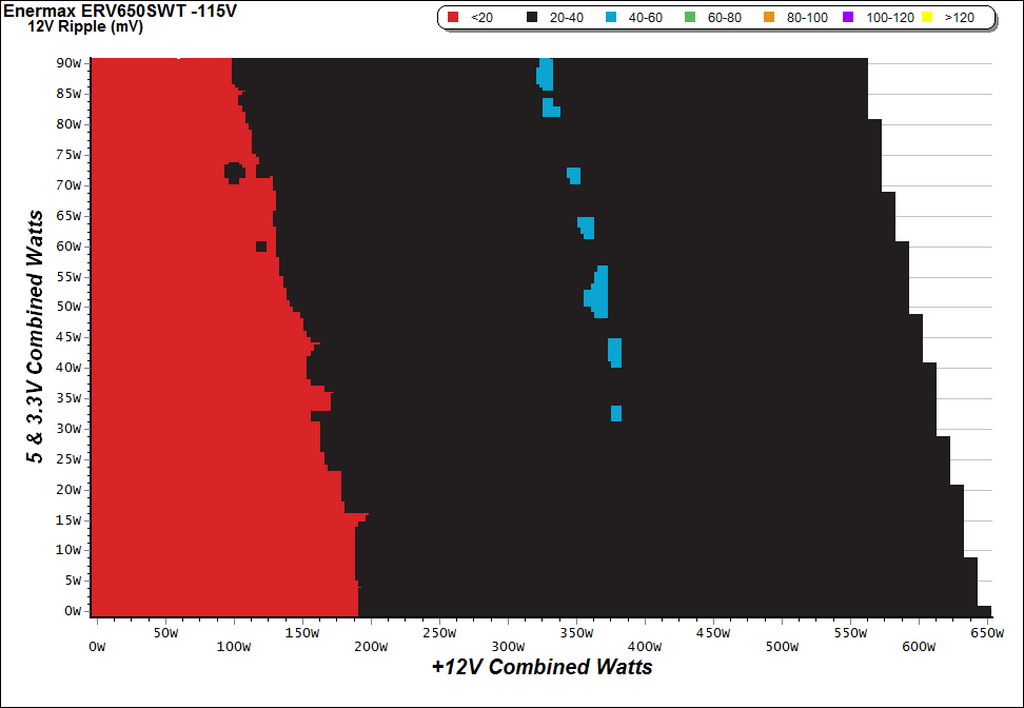
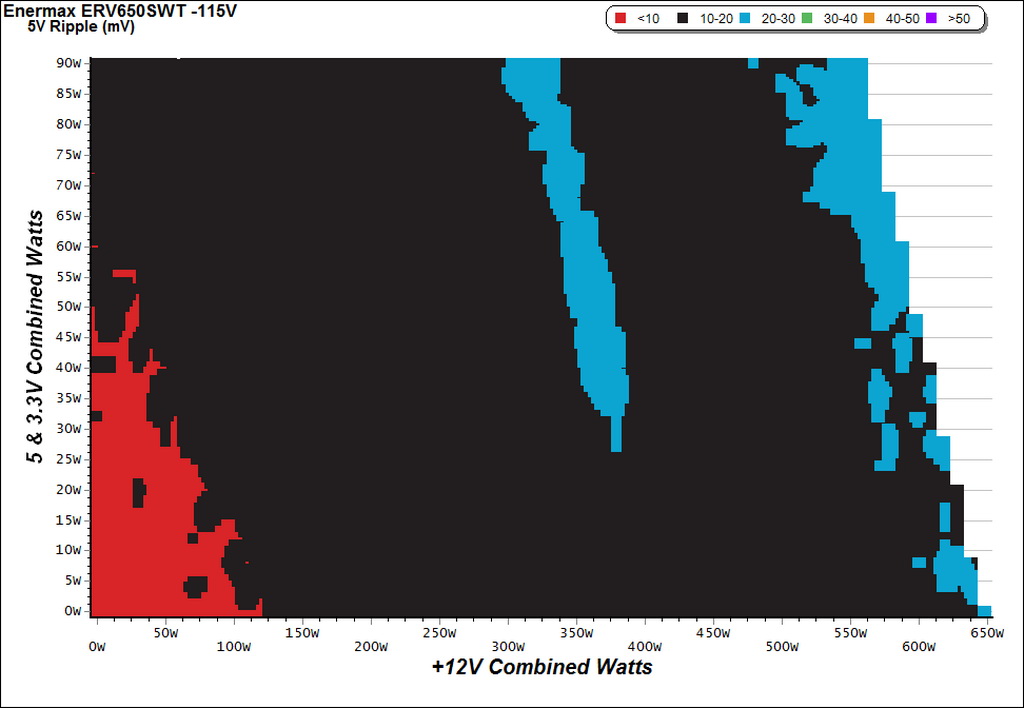
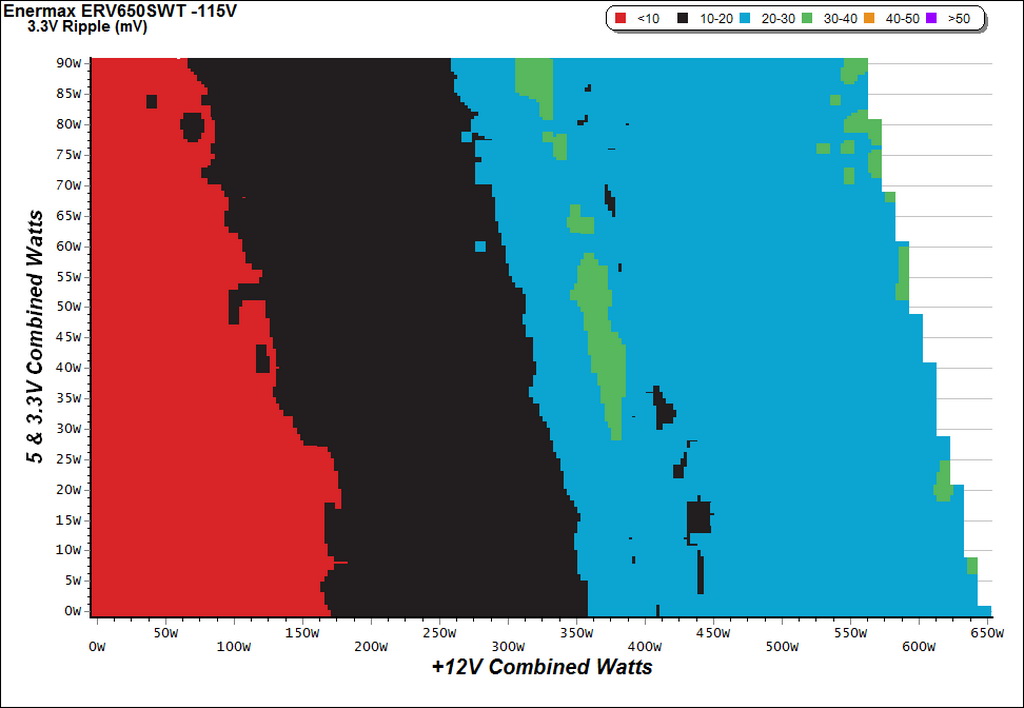
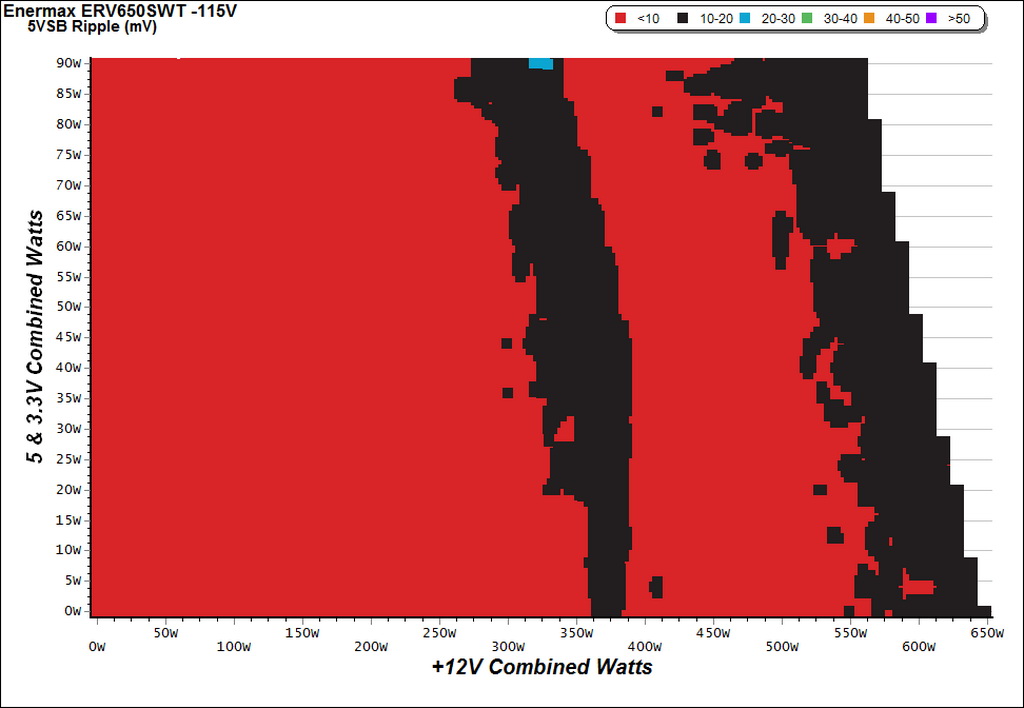
Infrared Images
We applied half-load for 10 minutes with the PSU's top cover and cooling fan removed before taking photos with our modified FLIR E4 camera that delivers 320x240 IR resolution (76,800 pixels).
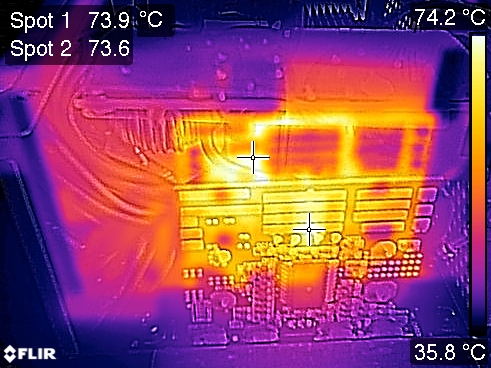
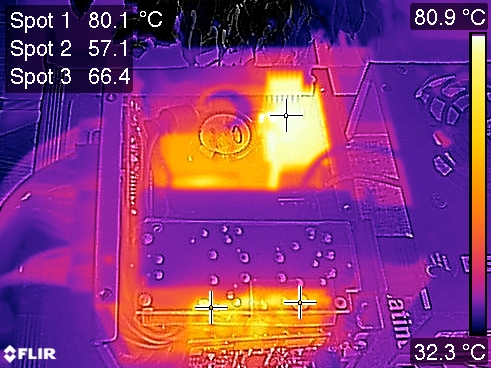
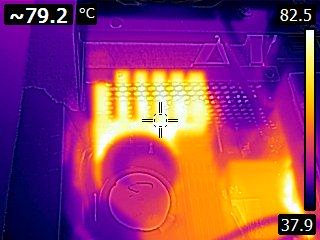
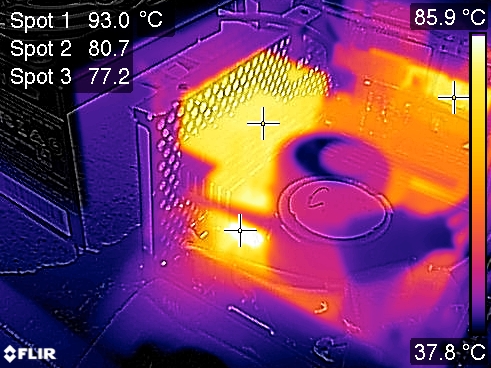
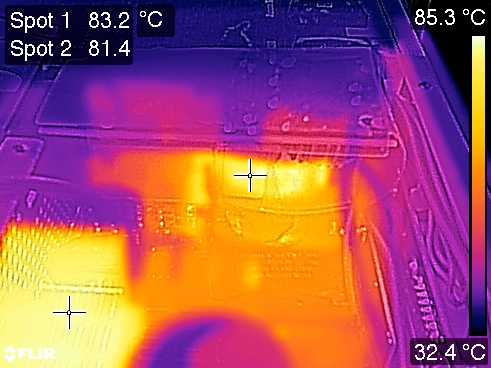
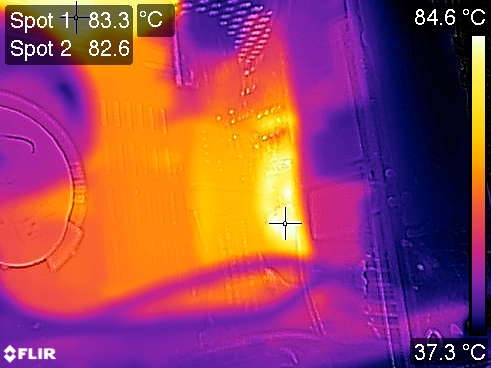
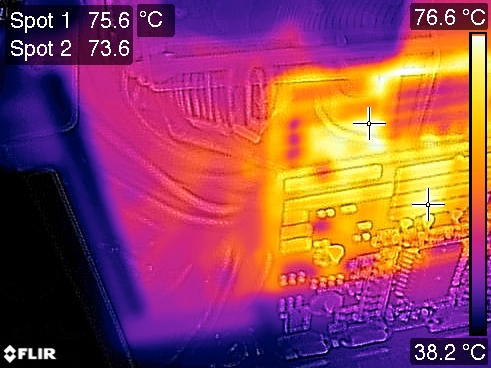
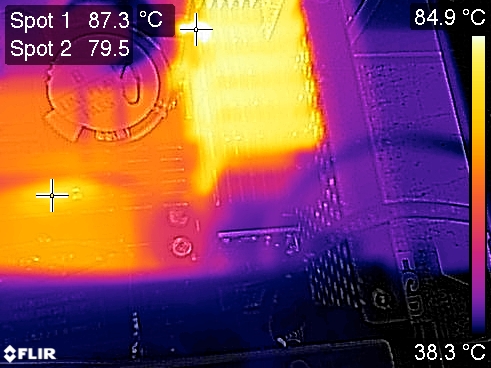
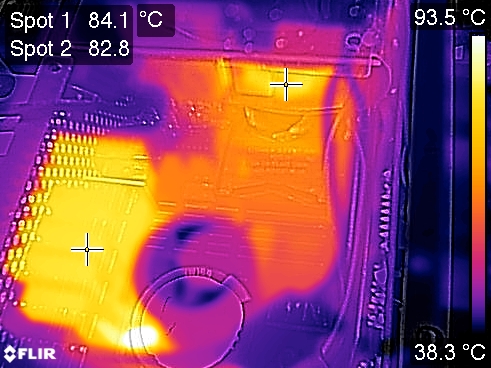
Given the main PCB's small size and this PSU's high capacity, it should come as no surprise that the primary and secondary heat sinks get really hot. What troubles us most, though, is the lack of airflow across the secondary side's filtering caps. This happens because the transient filter's PCB totally blocks that area. As a result, those caps are going to run hotter than they should, cutting into their usable lifetime. CWT should really find another place to put the transient filter, or somehow install it on the main PCB to avoid blocking airflow.
MORE: Best Power Supplies
MORE: How We Test Power Supplies
Get Tom's Hardware's best news and in-depth reviews, straight to your inbox.
MORE: All Power Supply Content
Current page: Cross-Load Tests & Infrared Images
Prev Page Protection Features Next Page Transient Response Tests
Aris Mpitziopoulos is a contributing editor at Tom's Hardware, covering PSUs.
-
shrapnel_indie How many motherboards require more than one EPS connector in the entry to enthusiast level motherboards (excluding server boards)? How many server boards? How many enthusiasts actually use server boards?Reply
IMHO, if a PSU has 1 or 2 EPS connectors shouldn't be a pro or con as the vast majority of boards used from entry level to enthusiast only really requires one connector. Server boards are a different matter. IMHO, just making a clear note how many EPS connectors should be good enough. -
TMTOWTSAC I can see wanting more than 2 PCIe of course, but how many SFX models come with 2 EPS? How many dual CPU micro atx mobos are there anyway?Reply -
Ne0Wolf7 Why would you ever want there not to be a power switch? I use mine all the time... It seems like such a simple thing to add too.Reply -
10tacle ^^That's the first thing I noticed in the pictures. I use mine on occasion too, especially when getting lockups during overclock testing. Flicking a switch is a lot more convenient than reaching around and unplugging and making sure the cable doesn't fall down behind the desk causing colorful four letter language. Unwise omission that is inexcusable in this category of PSU. I would rule out this PSU just for that omission alone.Reply
-
Aris_Mp about the two EPS connectors, most mid to high-end mainboards use one EPS and one ATX12V (so they need two CPU connectors) especially the new ones. Why not have this option and be restricted to mainstream mainboards. Not only server or dual CPU mainboards require two EPS connectors.Reply -
Marcus52 Enermax still hasn't recovered their quality since they shut down their own production facilities, which is a real shame, they used to be one of the best.Reply -
superflykicks03 You guys literally have ads that play over the top of your intrusive popup videos. You literally have to watch a 30 second ad before you get to watch the unwanted video :/ Not exactly user friendly. I know I know revenue blah blah, and just get a popup blocker yadda yadda.Reply -
maxwellmelon Why would you turn off the power on the power supply on computer lockup. Just hit the reset switch. I would venture to say 9 out of 10 people could care less as there pc is always on.Reply -
10tacle Because hitting reset from the case button does not guarantee a solid reboot. On my system anyway.Reply -
warmon6 For an SFX psu, not having a power switch on the PSU doesn't bother me to much.Reply
Depending on the case design (like my rvz01), you couldn't access the psu without taking the computer apart to access that switch. So unplugging the computer or holding the power button for 5 seconds would be a lot faster.
Now if this was an ATX PSU i would give a bit more care for as it's extremely rare for an ATX psu to be placed somewhere else inside the case that cant be access from the outside.
@10TACLE
I do have to ask though, does your computer lock up so much that even holding the case power button for the 3 to 5 seconds does nothing?
Most computers I've messed with seems to be able to power off fully even when there is a hard lockup doing that method.
But i do agree with you about that hitting a reset doesn't guarantee a solid reboot. Certainly when trying to dial in overclock settings.
