Silicon Power P34A80 PCIe Gen3x4 M.2 NVMe SSD Review: TLC Performance at QLC Prices
Why you can trust Tom's Hardware
1TB Performance Results
Comparison Products
We put the P34A80 up against its near twin, the MyDigitalSSD BPX Pro as well as a few other top contenders. From Samsung, we’ve added results from the 970 EVO Plus and 970 Pro. We also included the WD Black SN750 and Adata XPG SX8200 Pro. And for final reference, we’ve added in the Crucial P1, and entry-level NVMe SSD based on QLC NAND and the mainstream SATA SSD, the Crucial MX500.
ATTO
ATTO is a simple and free application that SSD vendors commonly use to assign sequential performance specifications to their products. It also gives us insight into how the device handles different file sizes.
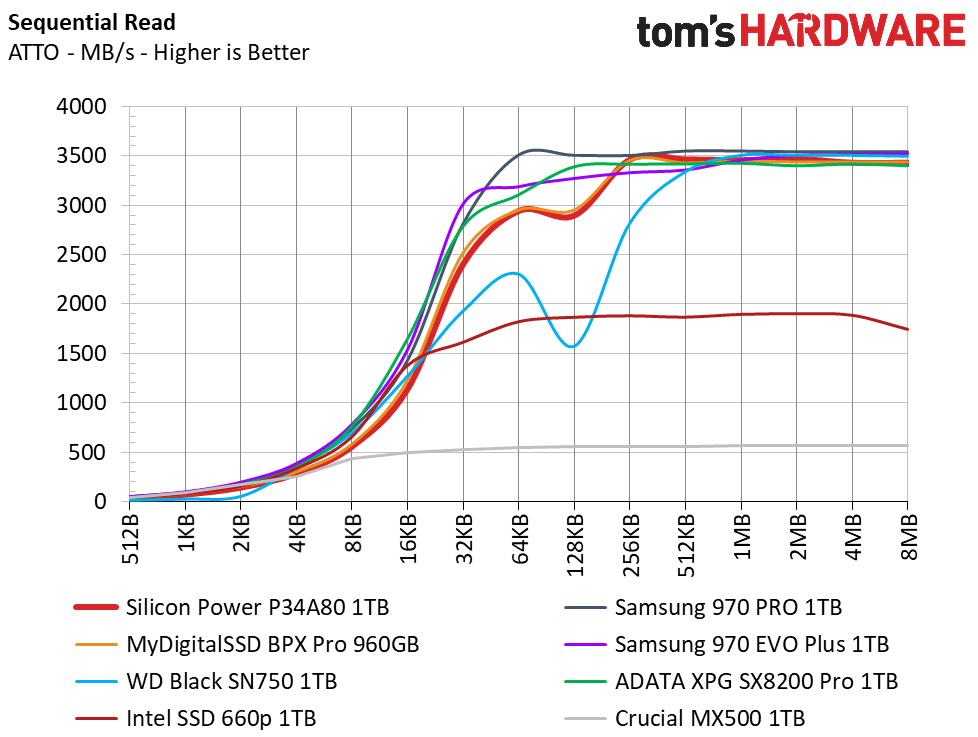
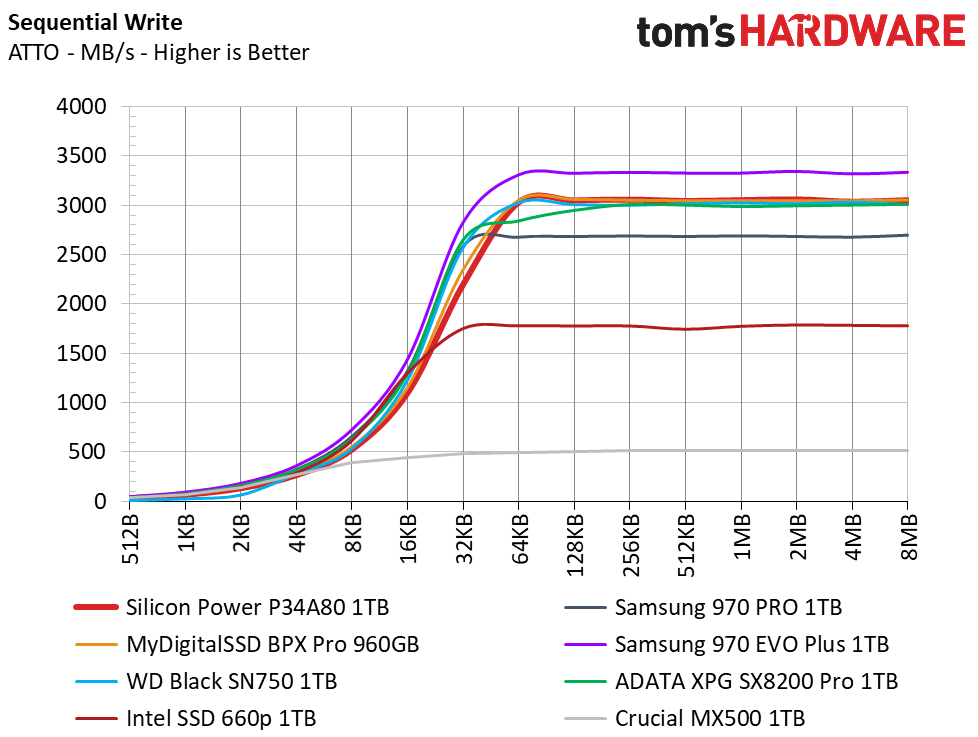
Silicon Power’s P34A80 mirrors the MyDigitalSSD BPX Pro in performance here. With speeds of almost 3.5/3.0 GB/s read/write, it hits its rated specs with ease. Only the Samsung 970 EVO Plus capable of surpassing its write speed, although some of its competitors were a bit faster with smaller file sizes during this test.
CrystalDiskMark
CrystalDiskMark (CDM) is a simple and easy to use file size benchmarking tool.
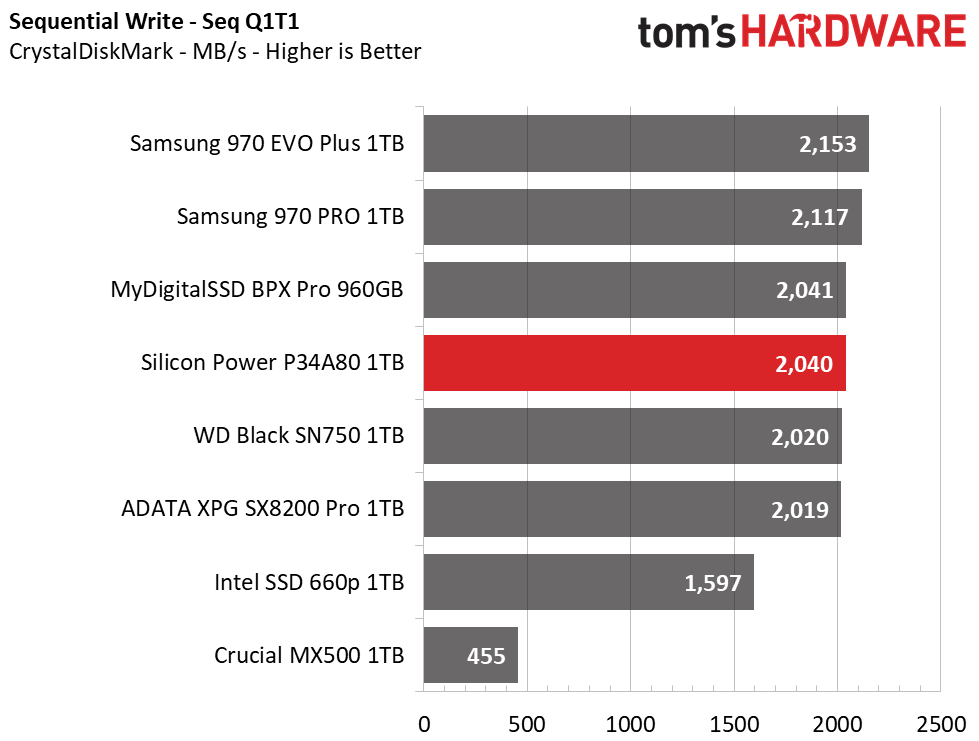
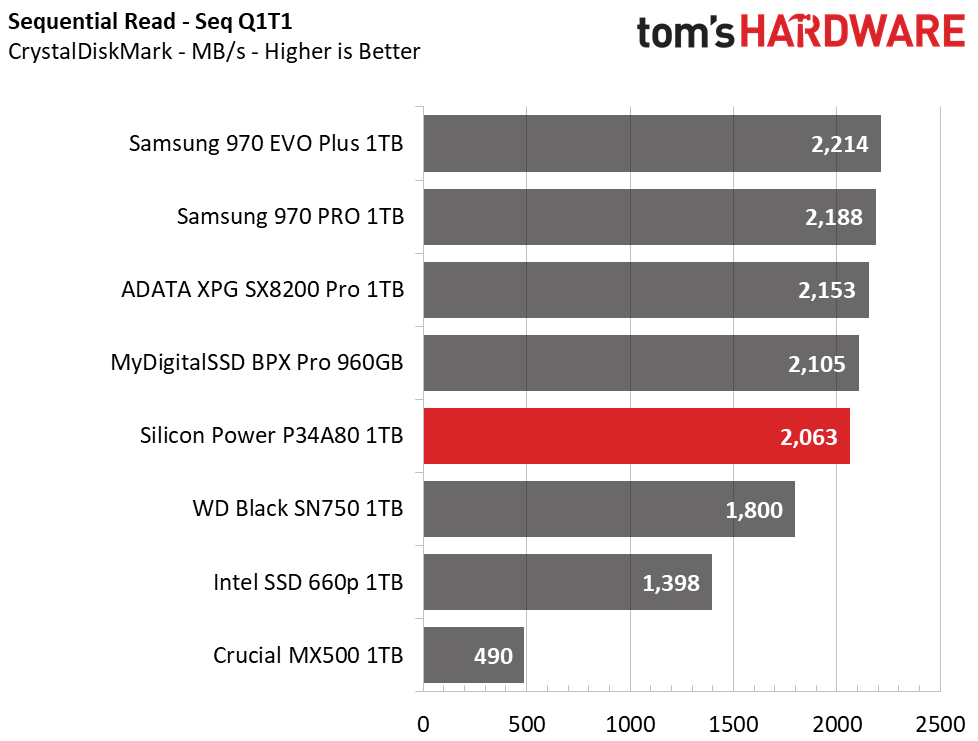
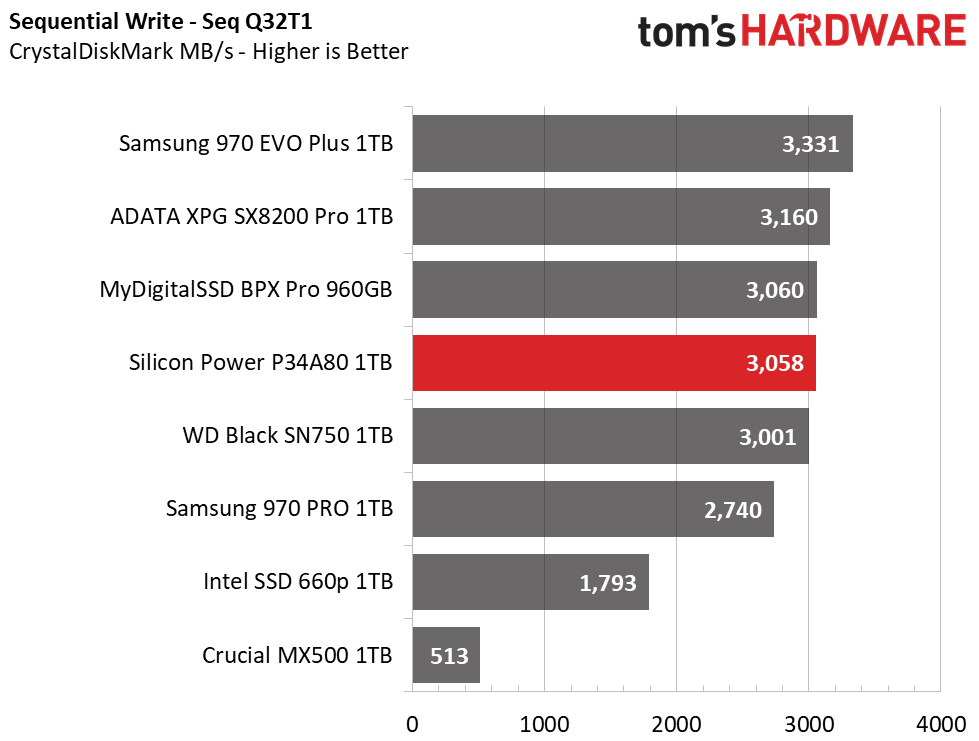
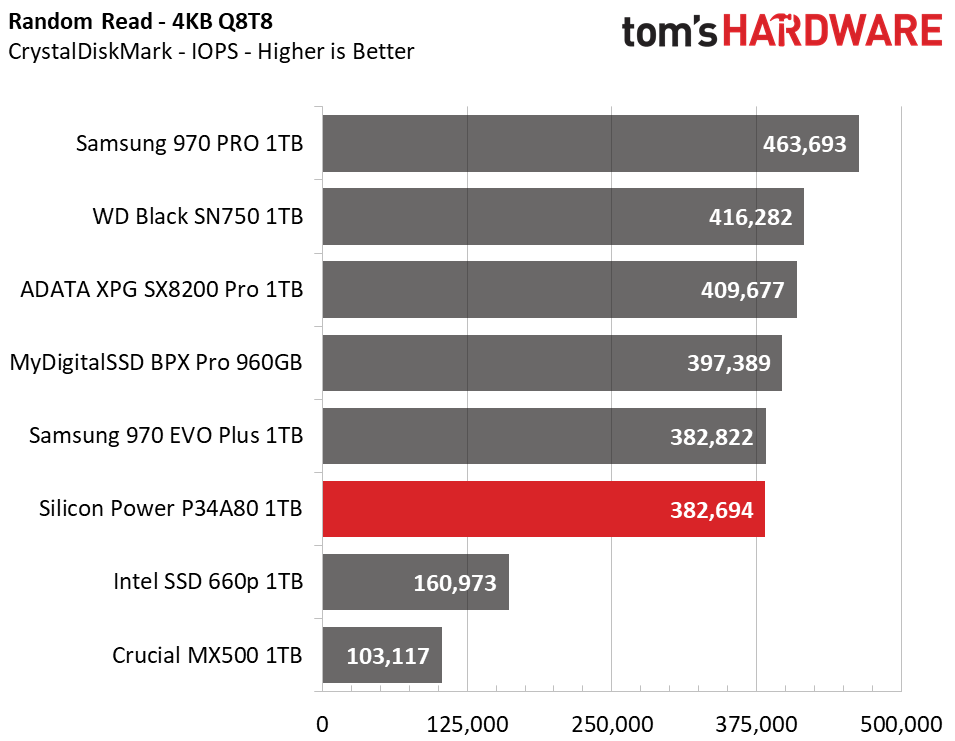
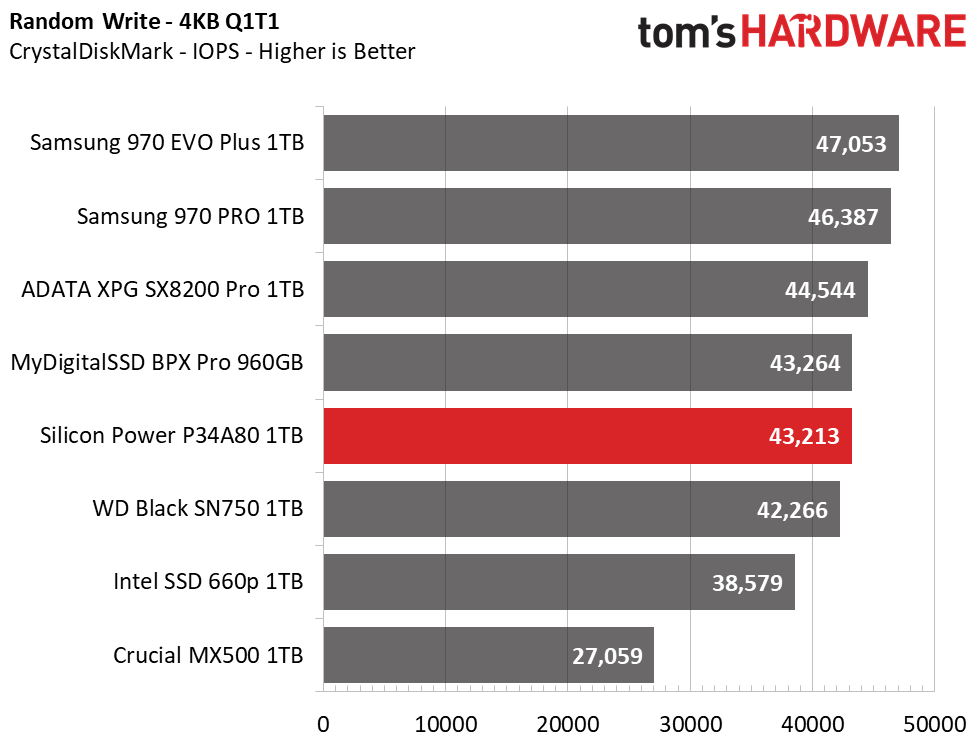
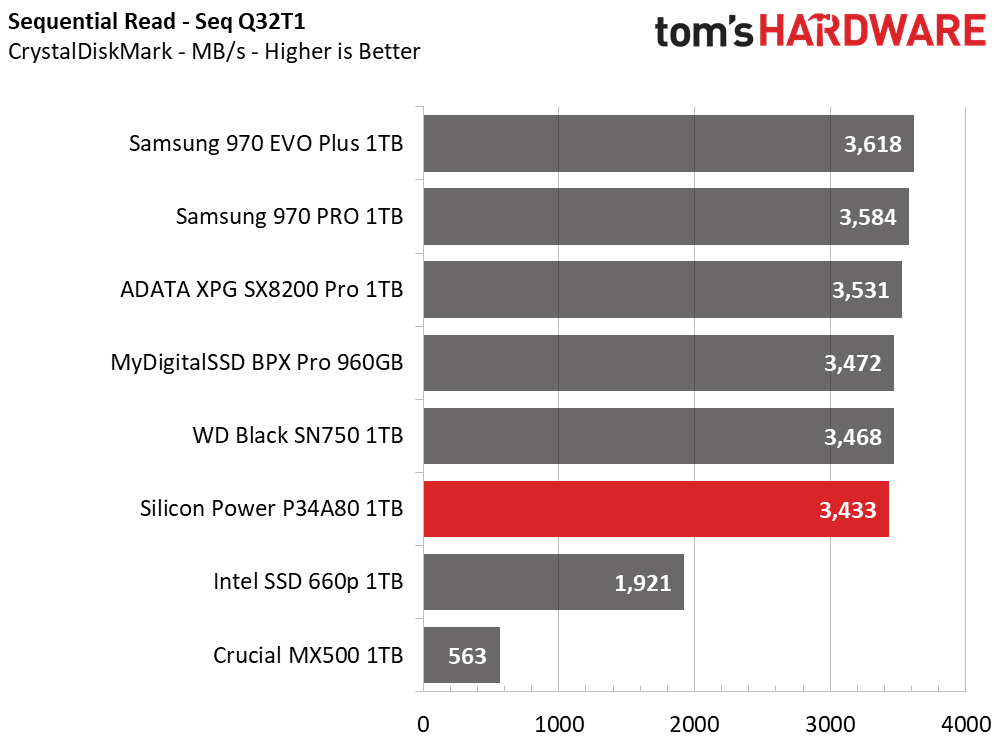
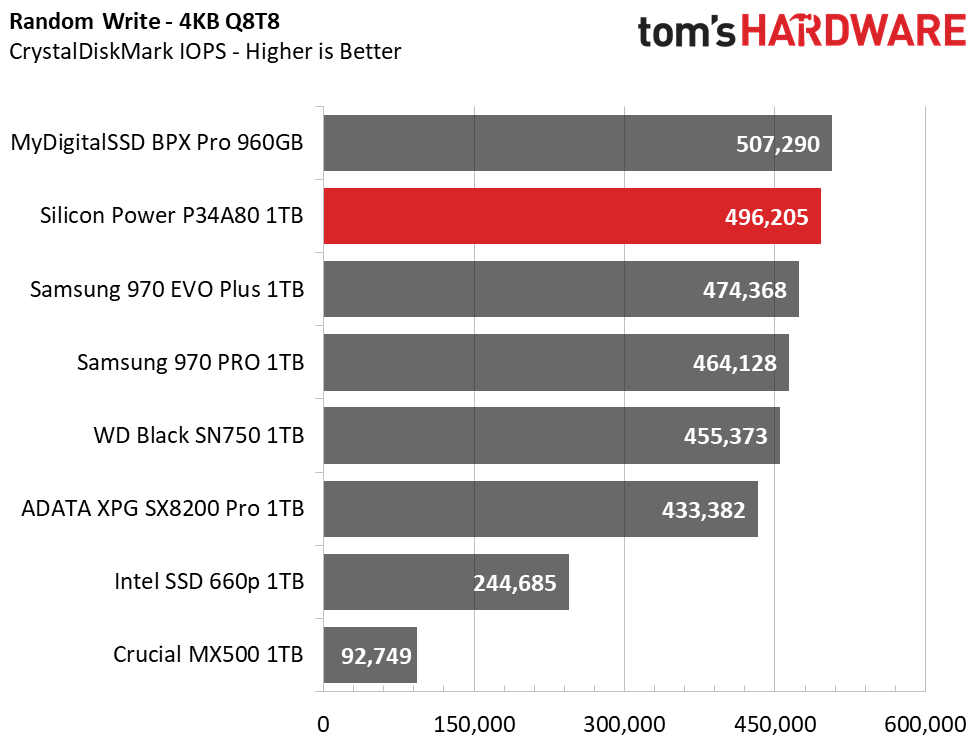
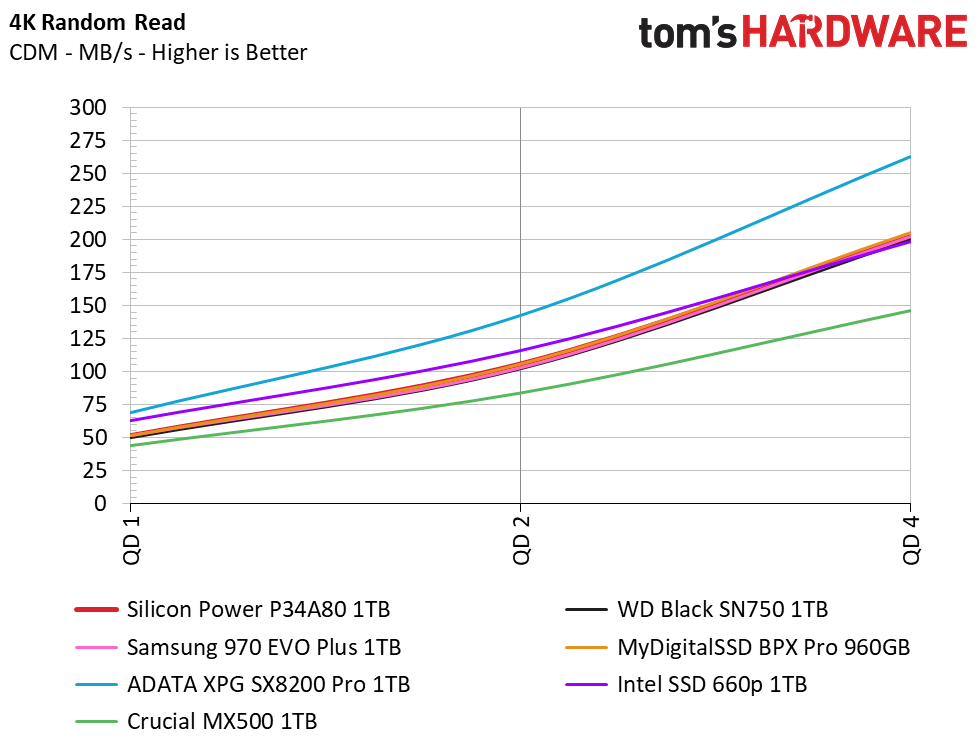
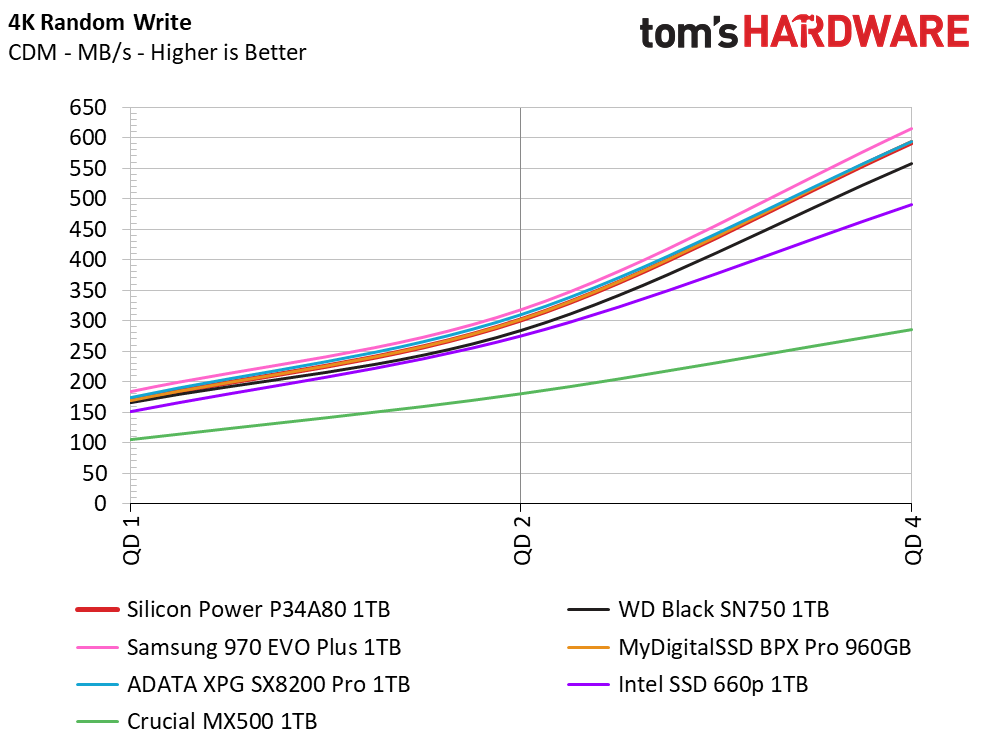
Crystal Disk Mark confirms the sequential performance of 3.4/3GB/s, just like we saw in ATTO. This performance is at a high QD, however, and is unrealistic. Dialing things back down to a queue depth (QD) of 1, we see that the P34A80 is capable of just 2 GBps read and write speed.
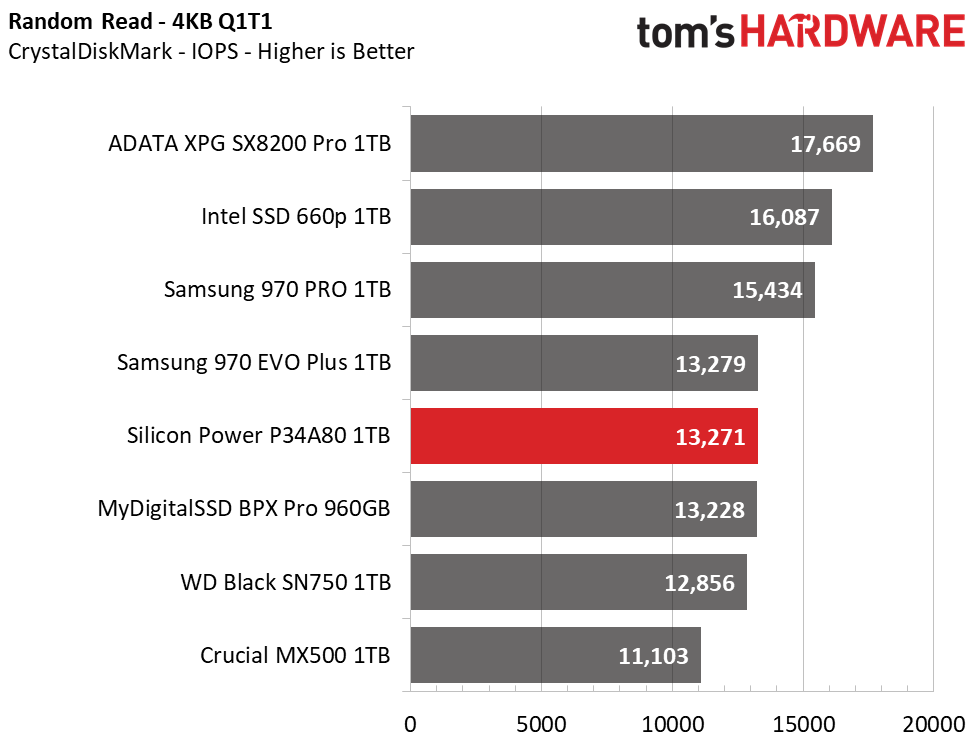
As well, we see that 4K performance hits 382K/496K IOPS read/write at a QD of 64. This is very high performance, but it doesn’t help us gauge the device’s real-world application performance. For that, we look to smaller QDs, like 1-4. At QD1, where 80-90% of your workloads will land, the P34A80 delivered over 13K IOPS read and 43K IOPS write, which lands it in fifth place overall. QD2-4 show it is on par with most other devices.
Sustained Sequential Write Performance
Official write specifications are only part of the performance picture. Most SSD makers implement an SLC cache buffer, which is a fast area of SLC-programmed flash that absorbs incoming data. Sustained write speeds can suffer tremendously once the workload spills outside of the SLC cache and into the "native" TLC or QLC flash. We hammer the SSDs with sequential writes for 15 minutes to measure both the size of the SLC buffer and performance after the buffer is saturated.
Get Tom's Hardware's best news and in-depth reviews, straight to your inbox.
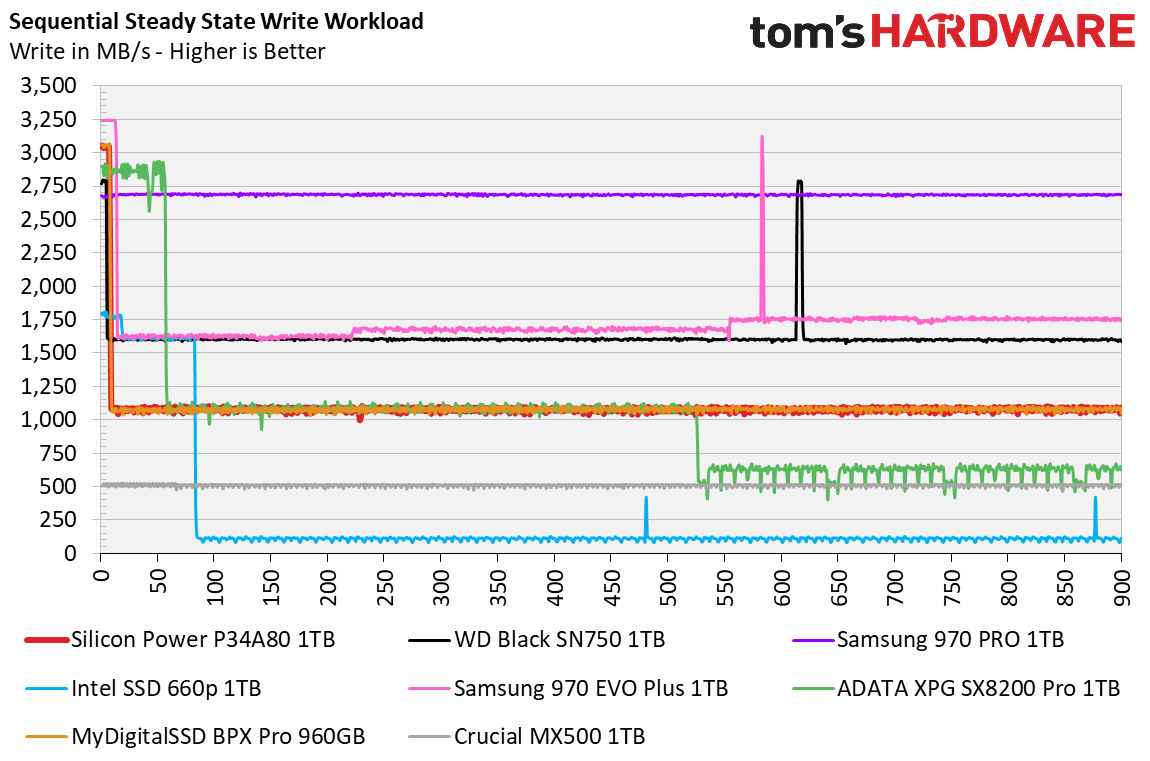
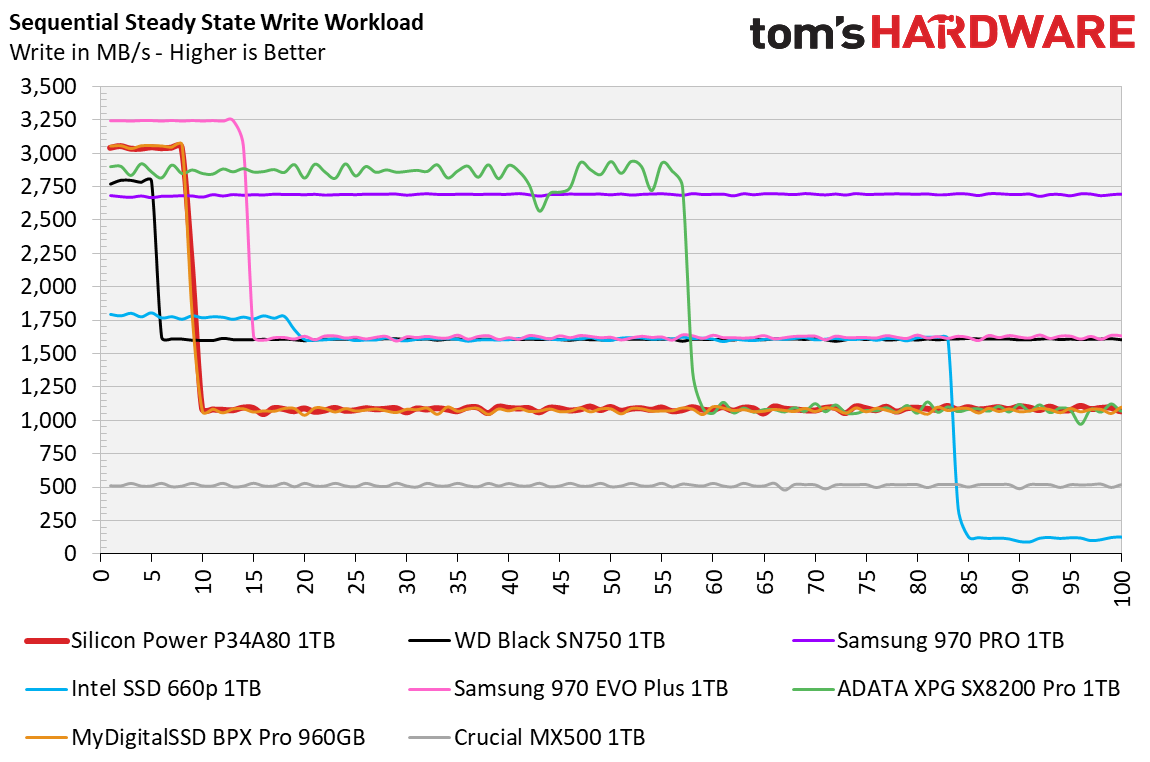
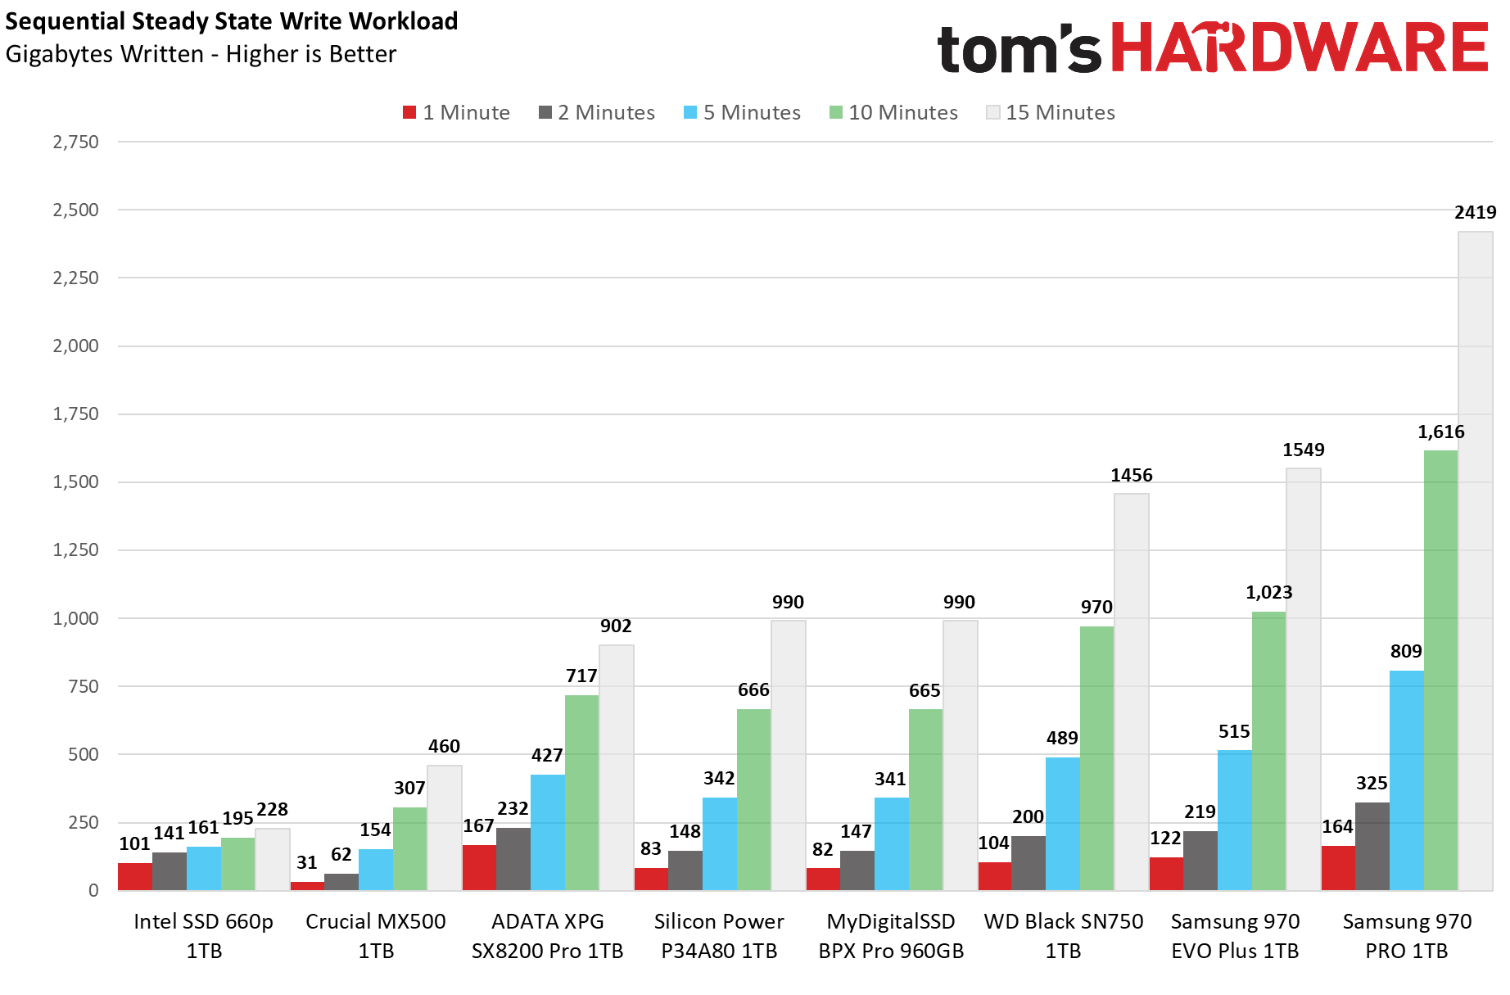
Because it has a Phison E12 NVMe controller at its heart, we know the Silicon Power P34A80 features an SLC write cache. After testing, we can see that it is capable of absorbing up to 24GB of data at 3GBps before performance degrades to native direct to TLC write speeds. This matches the MyDigitalSSD BPX Pro, although it does so without the extra overprovisioning. After the cache fills, write performance will degrade to just over 1GBps until it has a break to recover. Here it ties for fourth place overall.
Game Scene Loading - Final Fantasy XIV
The Final Fantasy XIV StormBlood benchmark is a free real-world game benchmark that easily and accurately compares game load times without the inaccuracy of using a stopwatch.
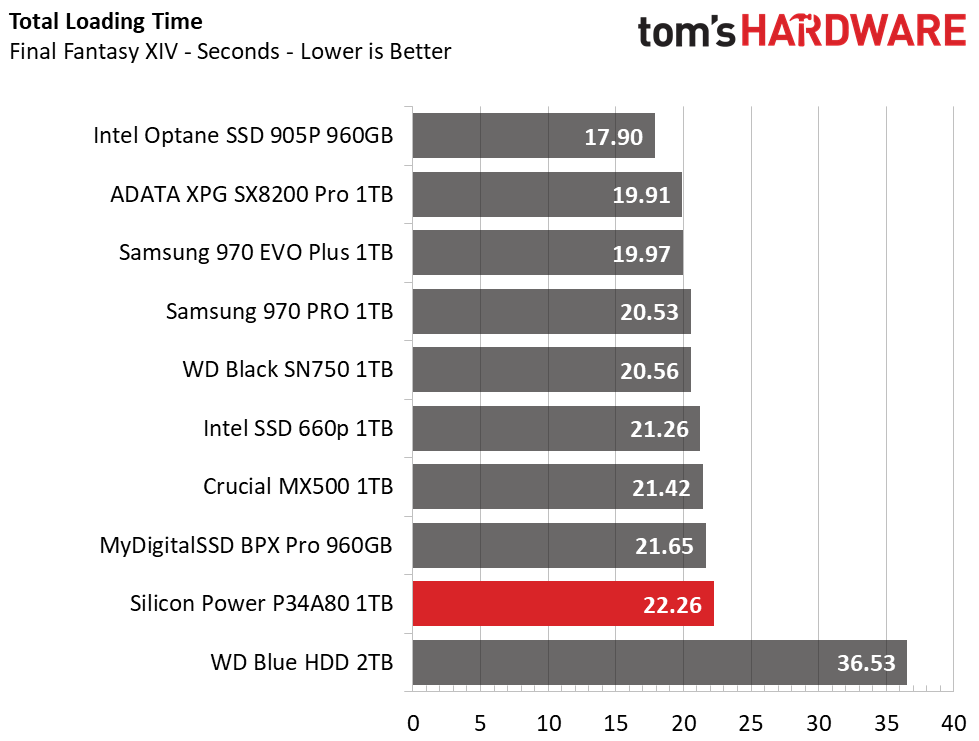
Like most Phison E12 powered SSDs, the P34A80 isn’t a leader in this test, rather it lands dead last in our comparison pool among SSDs. This leaves a 3-second gap between it and the Adata XPG SX8200 Pro, our fastest flash-based device in the comparison. So, overall, while it is in last place, a difference in three seconds isn’t too significant, and the Silicon Power drive is still much faster than an HDD.
Transfer Rates – DiskBench
We use the DiskBench storage benchmarking tool to test file transfer performance with our own custom 50GB block of data. Our data set includes 31,227 files of various types, like pictures, PDFs, and videos. We copy the files to a new folder and then follow up with a read test of a newly-written 6GB file.
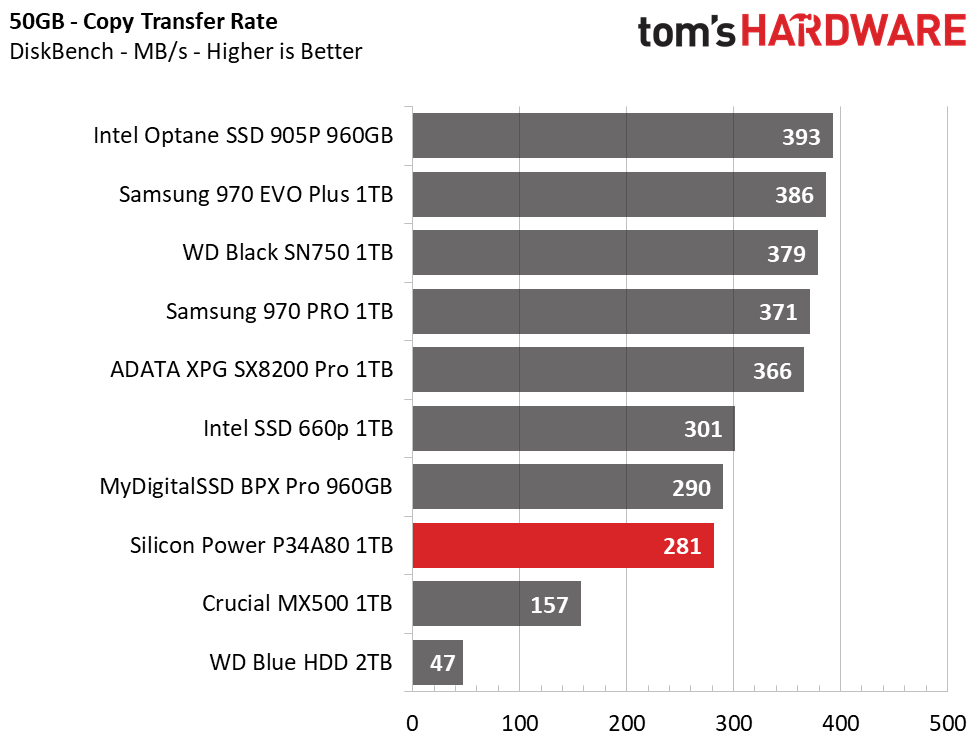
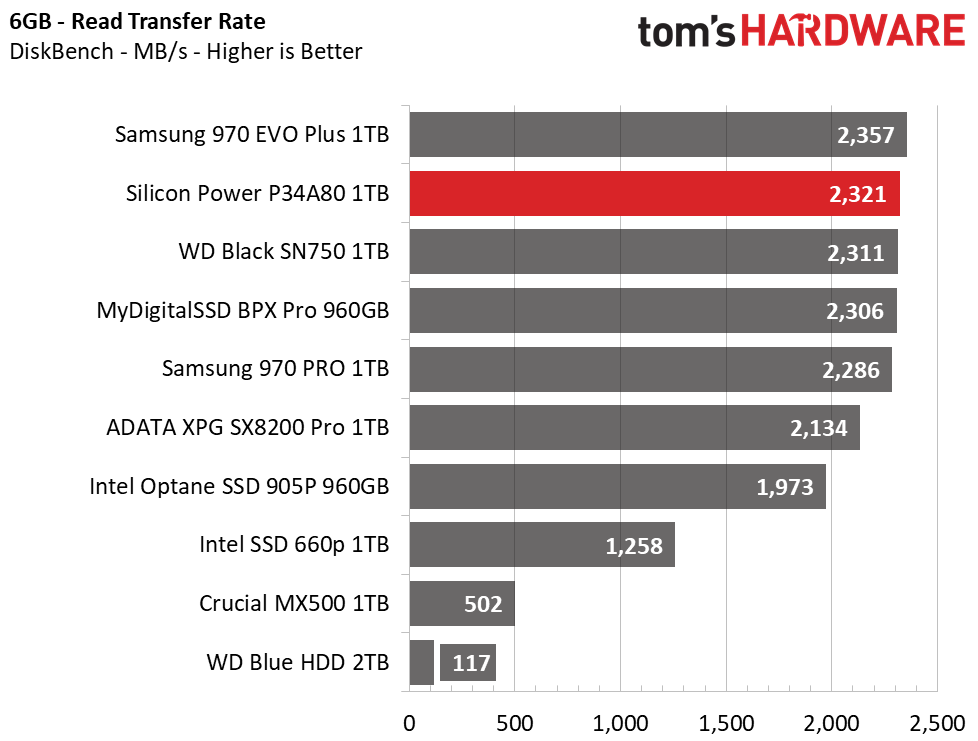
Our 1TB Silicon Power P34A80 was able to copy our 50GB file folder at a rate of 281MBps. This is about the same as the BPX Pro, but overall ranks it as the slowest NVMe SSD in the group. It is, though, twice as fast as the SATA based MX500 here. As well, during the 6GB file read test, it scored second place, just behind that of the Samsung 970 PRO.
Trace Testing – PCMark 8 Storage Test 2.0
PCMark 8 is a trace-based benchmark that uses Microsoft Office, Adobe Creative Suite, World of Warcraft, and Battlefield 3 to measure the performance of storage devices in real-world scenarios.
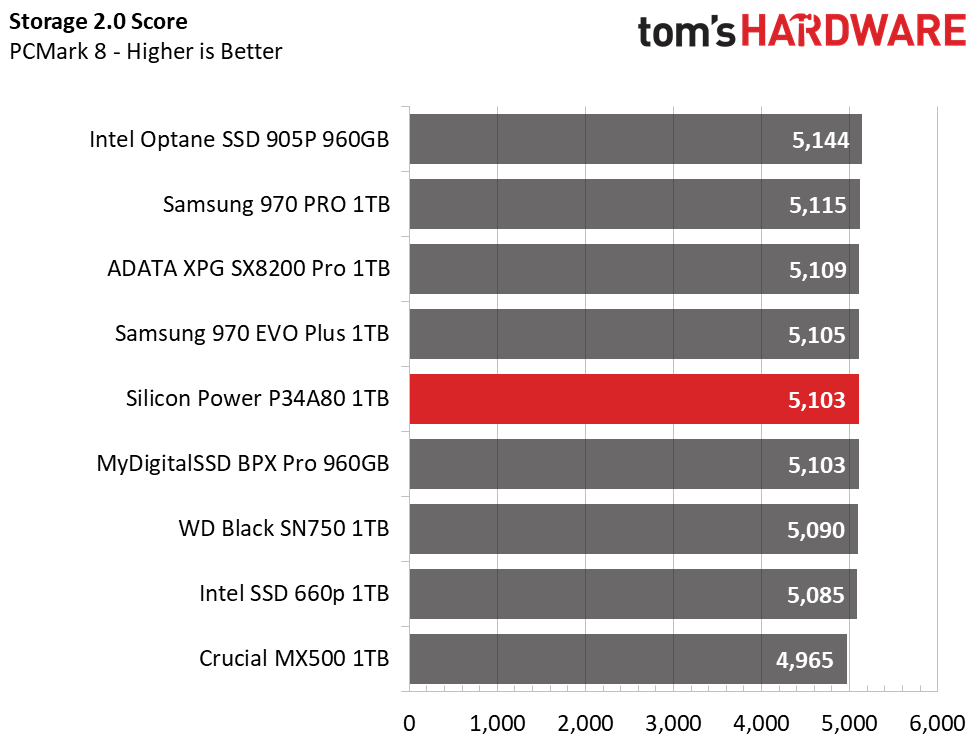
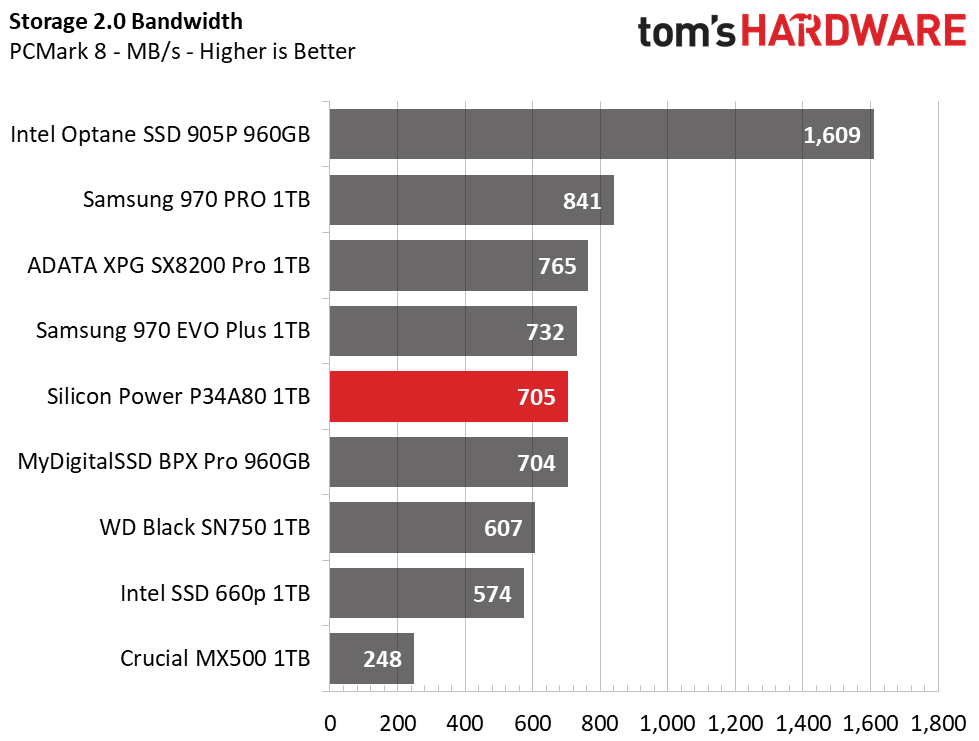
The Silicon Power P34A80 achieved an overall score of 5,103 points and an average bandwidth of 705MBps here. The Silicon Motion SM2262EN powered Adata XPG SX8200 Pro managed to squeeze out a little more application performance on this test, but the P34A80 is still a high-end contender and lands in fifth place overall, just behind the Samsung 970 EVO Plus.
SYSmark 2014 SE
Like PCMark, SYSmark uses real applications to measure system performance. SYSmark takes things much further, however. It utilizes fourteen different applications to run real workloads with real data sets to measure how overall system performance impacts the user experience. BAPCo's SYSmark 2014 SE installs a full suite of applications for its tests, which includes Microsoft Office, Google Chrome, Corel WinZip, several Adobe software applications, and GIMP. That also makes it a great test to measure the amount of time it takes to install widely-used programs after you install a fresh operating system.
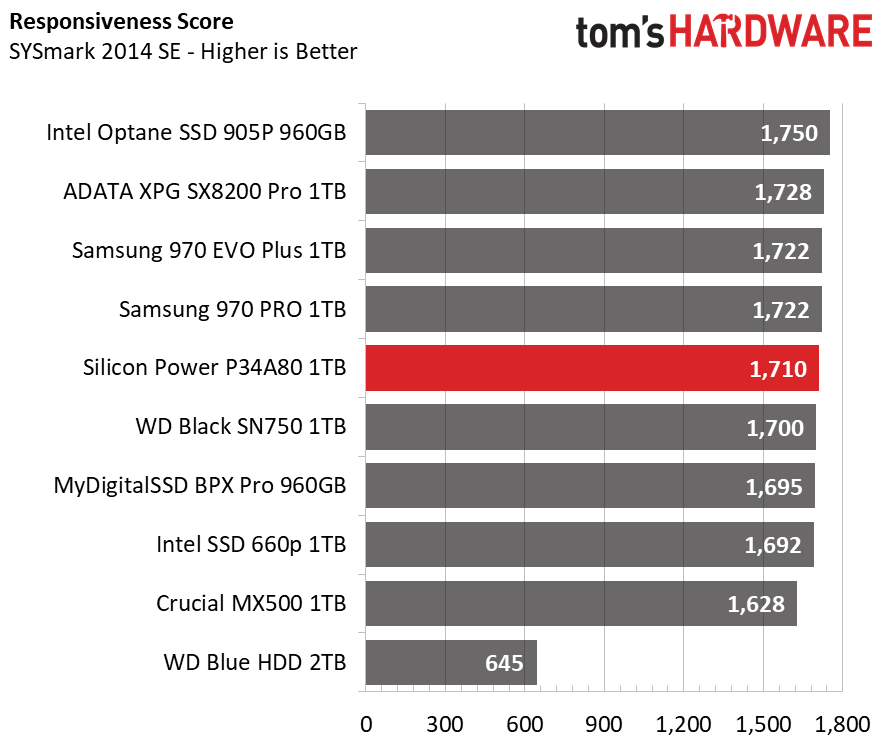
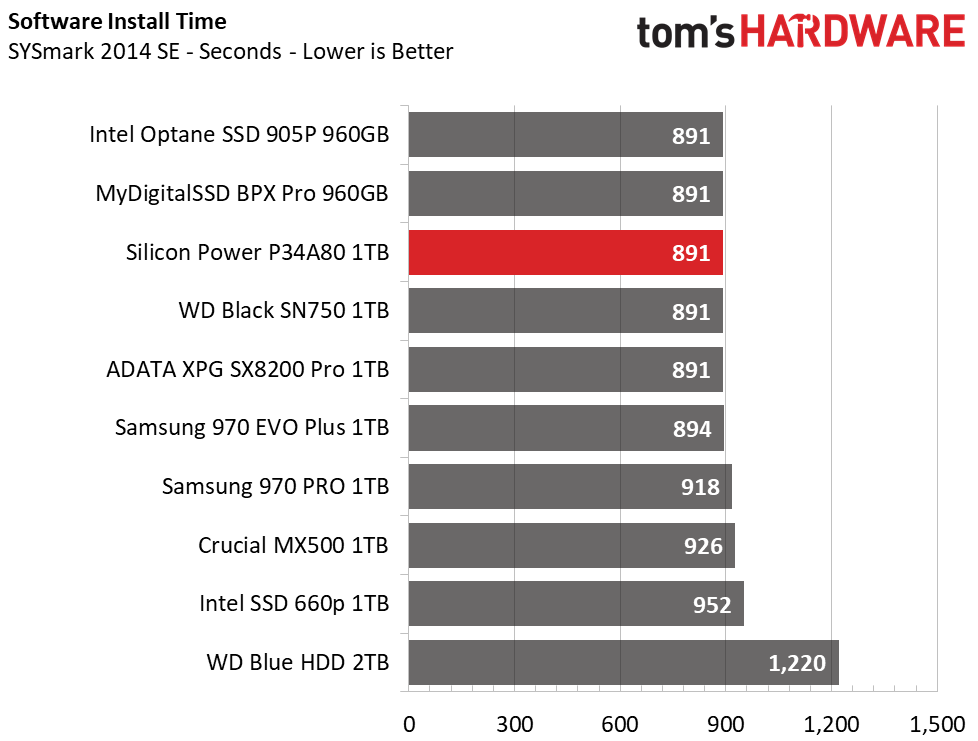
Similar to what we saw with PCMark 8, in SYSmark 2014 SE the Silicon Power P34A80 ranks between the Samsung 970 EVO Plus and the WD Black SN750 again.
Power Consumption
We use the Quarch HD Programmable Power Module to gain a deeper understanding of power characteristics. Idle power consumption is a very important aspect to consider, especially if you're looking for a new drive for your laptop. Some SSDs can consume watts of power at idle while better-suited ones sip just milliwatts. Average workload power consumption and max consumption are two other aspects of power consumption, but performance-per-watt is more important. A drive might consume more power during any given workload, but accomplishing a task faster allows the drive to drop into an idle state faster, which ultimately saves power.
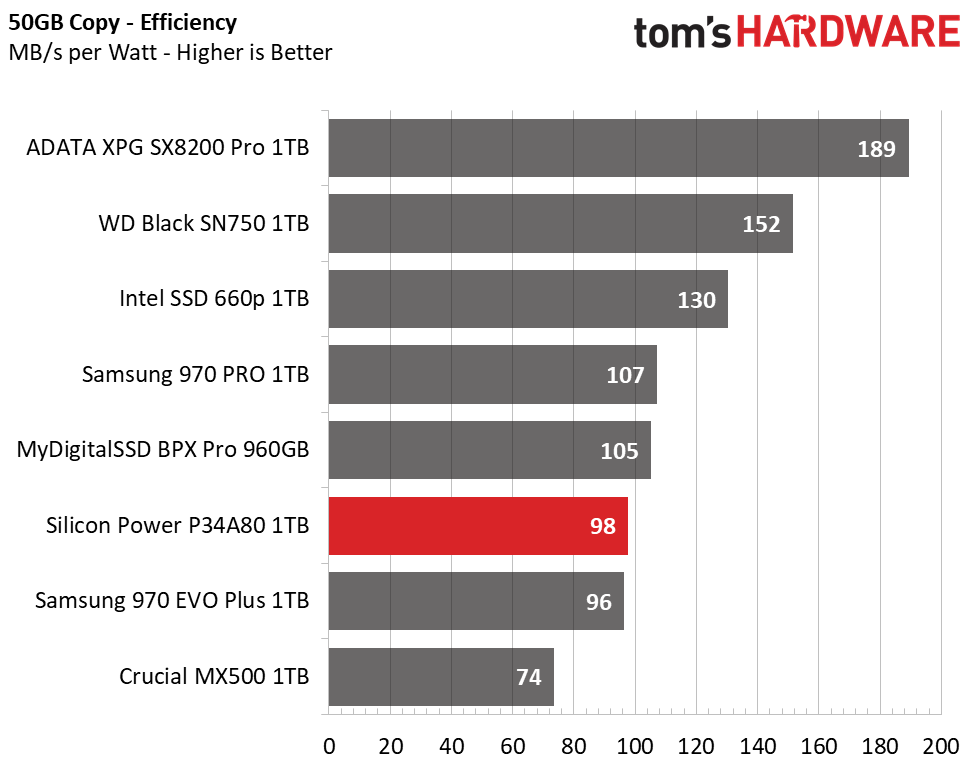
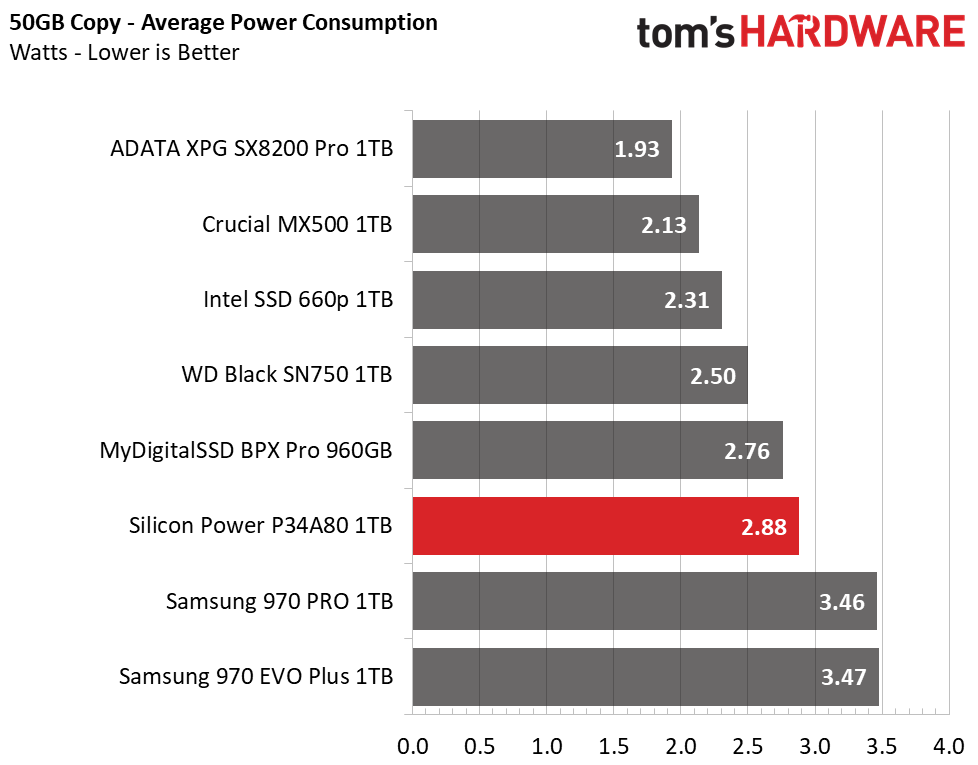
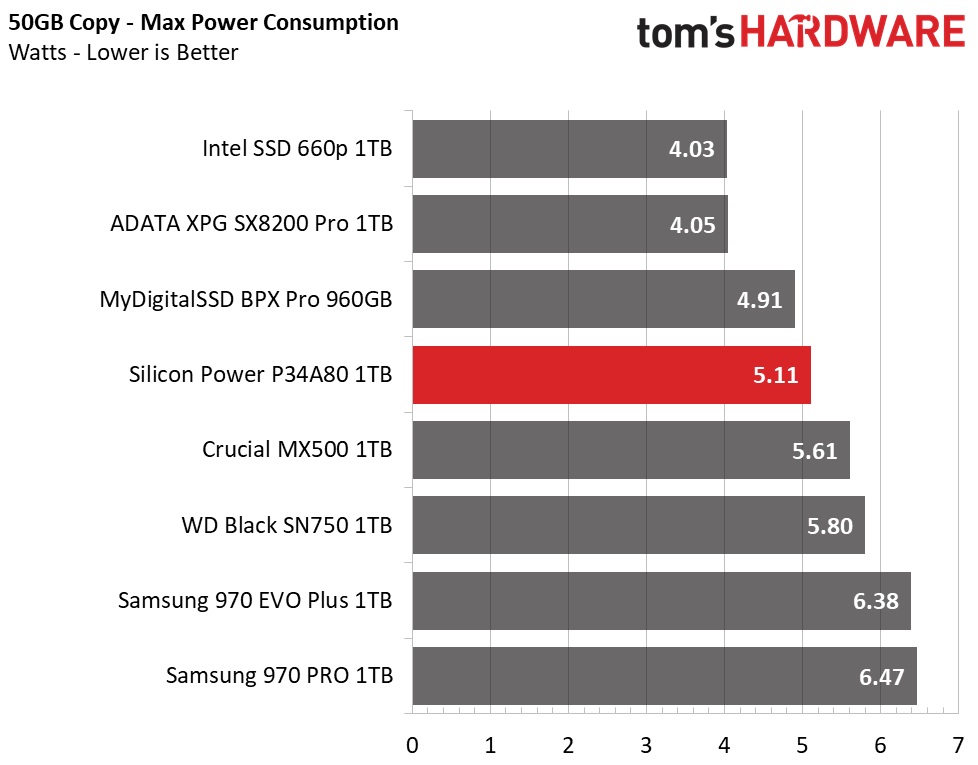
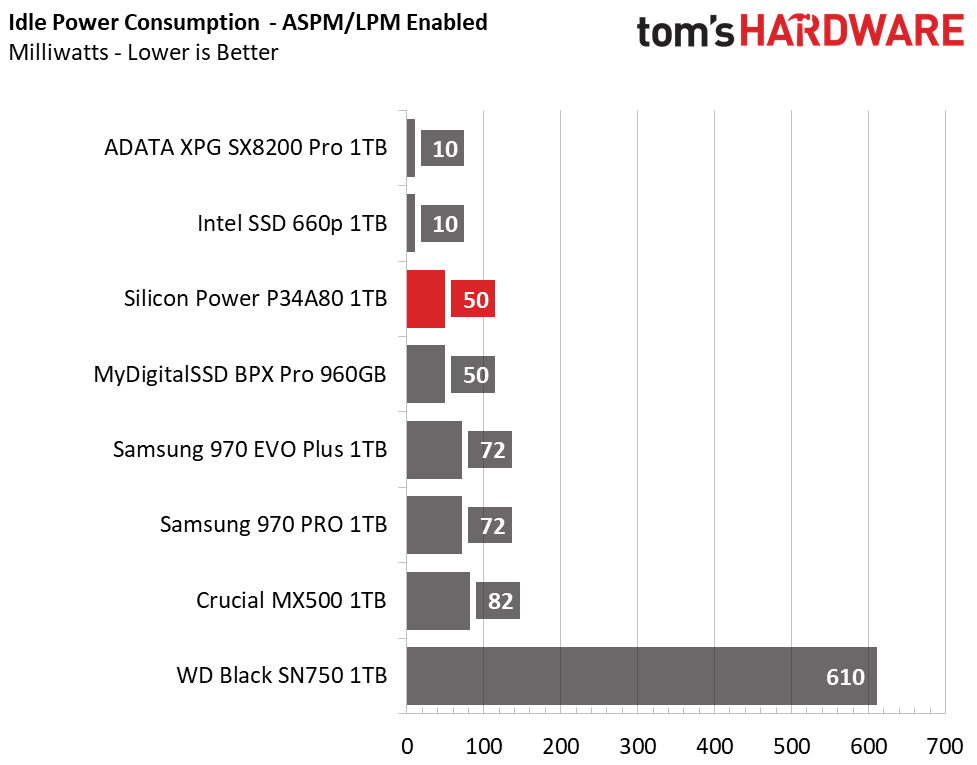
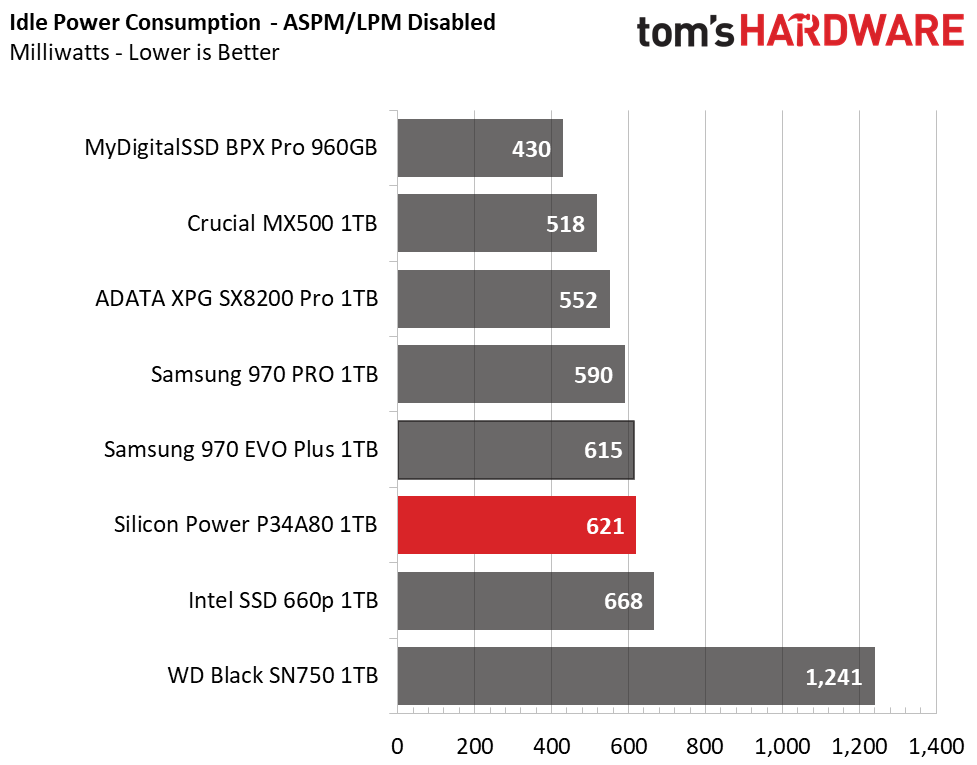
With an average power consumption of 2.88 watts, Silicon Power’s P34A80 it ranks sixth in our power efficiency test. It hits a max of 5.11W, which isn’t too high. At idle it consumes 621 milliwatts with ASPM disabled, but once enabled this amount decreases significantly to just 50mW. Overall, it is a bit more power hungry than the MyDigitalSSD BPX Pro, but is still rather well regulated.
MORE: Best SSDs
MORE: How We Test HDDs And SSDs
MORE: All SSD Content

Sean is a Contributing Editor at Tom’s Hardware US, covering storage hardware.
-
zaphod_ It seems Silicon Power is grossly conservative with the endurance rating. Similar drives have dramatically higher published endurance ratings. I would assume the same nand and same controller would have the same, or very similar, endurance. This is indeed the case with other E12/bics3 nand drives. The BPX Pro and MP510 are identical hardware with over-provisioning have ~1700TBW/960GB. Inland Premium (Microcenter house brand) is same hardware without any over-provisioning has a 1600TBW endurance for a 1TB drive.Reply
Its hard to believe the Silicon Power P34A80 has less than a third of the endurance of other drives featuring the exact same hardware.
Where does the meager 125TBW/256GB endurance rating come from? It doesn't appear that Silicon Power published an endurance number on their website. -
zaphod_ Sabrent Rocket is another budget E12/bics3 drive with a rating of 1665 TBW/1TB.Reply
TEAM GROUP MP34 is also rated at 1665 TBW/1TB.
Five other drives with the E12/bics3 all have 1600+ TBW for a 1TB class drive.
Hard to believe that the Silicon Power only has 500TBW/1TB -
seanwebster Reply
I would guess that it has to do with limiting their liability. The endurance ratings come directly from the company after my inquiry.zaphod_ said:It seems Silicon Power is grossly conservative with the endurance rating. Similar drives have dramatically higher published endurance ratings. I would assume the same nand and same controller would have the same, or very similar, endurance. This is indeed the case with other E12/bics3 nand drives. The BPX Pro and MP510 are identical hardware with over-provisioning have ~1700TBW/960GB. Inland Premium (Microcenter house brand) is same hardware without any over-provisioning has a 1600TBW endurance for a 1TB drive.
Its hard to believe the Silicon Power P34A80 has less than a third of the endurance of other drives featuring the exact same hardware.
Where does the meager 125TBW/256GB endurance rating come from? It doesn't appear that Silicon Power published an endurance number on their website. -
zaphod_ It seems quite likely the Silicon Power endurance information is erroneous. How could one explain that of the six drives mentioned, all with Phison E12 controller and BICS3 NAND, five have 1600+TBW ratings and one has a 500TBW rating. Logic would suggest the 500TBW rating is simply wrong.Reply -
veegee24 Replyzaphod_ said:It seems quite likely the Silicon Power endurance information is erroneous. How could one explain that of the six drives mentioned, all with Phison E12 controller and BICS3 NAND, five have 1600+TBW ratings and one has a 500TBW rating. Logic would suggest the 500TBW rating is simply wrong.
I contacted their tech support, they said the 2TB model has an endurance of 3115TB. -
ken-wawa According to the review, this disk should ensure AES encryption. How to start using it/set password? Is that executed through disk password in BIOS? Have anyone succeded in setting this? If yes in what laptop?Reply -
ken-wawa Ok, I've received the answer from Silicon Technology and... they are saying that this disk is NOT supporting any encryption. As I was furious and very confused I've asked them once again and they answered the same saying that they confirmed this twice with engineers. So forget about hardware encryption guys.....Reply -
Joshua_157 Reply
I have this and I am returning it for incompatibility reasons.Admin said:The Silicon Power P34A80 comes with all the performance you could ask for from a high-end TLC based SSD at a similar cost to those QLC based SSDs like the Intel SSD 660p and Crucial P1. What’s not to love?
Silicon Power P34A80 PCIe Gen3x4 M.2 NVMe SSD Review: TLC Performance at QLC Prices : Read more
it's like this , every ssd Nvme Pcie I have reports as 512 sector the brands are Crucial and Samsung yet this reports as 4096 regardless of the enclosure you put it in as I also found out that all enclosures use the same chipset .It means you can't clone to this drive because it does not use 512e it's 4kn and that is the way it stays .
I'm going back to Samsung at least I know I can clone to their drives because of the chipset they use which is different from the Silicon power chipset.
It's something you should be aware of as I have dragged the internet looking for some meaningful advice but in the end nobody knows , so just be aware you can't change the sector size and it will always report as 4096 because of the controller. -
seanwebster Reply
Interestingly, there are tools out there to change that tho. Have you emailed them? I know Sabrent has one for their E12-based SSDs. You can also use your motherboard's built-in secure erase tool to switch between 512e and 4K sectors if it has one. What software are you using? Ideally, it should be able to clone over the data regardless of source and destination sector sizes, it seems tho that the software is lagging support for the hardware here.Joshua_157 said:I have this and I am returning it for incompatibility reasons.
it's like this , every ssd Nvme Pcie I have reports as 512 sector the brands are Crucial and Samsung yet this reports as 4096 regardless of the enclosure you put it in as I also found out that all enclosures use the same chipset .It means you can't clone to this drive because it does not use 512e it's 4kn and that is the way it stays .
I'm going back to Samsung at least I know I can clone to their drives because of the chipset they use which is different from the Silicon power chipset.
It's something you should be aware of as I have dragged the internet looking for some meaningful advice but in the end nobody knows , so just be aware you can't change the sector size and it will always report as 4096 because of the controller. -
Co BIY Amazon reviews on the Silicon Power P34A80 report that the Toshiba NAND has been replaced by a UNIC branded package and that the Hynix DDR4 DRAM has been replaced with Nanya DDR3.Reply
I would think that the expected performance from DDR3 would be less.
- From Zaphod_"How could one explain that of the six drives mentioned, all with Phison E12 controller and BICS3 NAND, five have 1600+TBW ratings and one has a 500TBW rating. Logic would suggest the 500TBW rating is simply wrong."
Bait and Switch was probably planned and explains the extremely conservative endurance numbers put out.
My guess is that Silicon Power's P34A60 reviewed with Intel NAND will probably also be subbed for brand-Xi chips.
I have been shopping for a new boot/main drive and this is the second drive I have been very close to buying only to find that the drive for sale is not the same as the drive reviewed and compared to the competition. I was looking at buying the highly rated XPG SX8200 Pro recommended here at Tom's but found that recent purchaser's found that the expected Micron NAND had been replaced by UNIC branded chips and I saw that the production location listed had changed from "Made in Taiwan" to "Made in China".
I expect that businesses will switch suppliers and that they will cut corners to cut costs. I know a "Bait and Switch" is just a traditional, if dishonest and dirty, sales tactic.
Sometimes a dishonest business tactic is a small part of a larger aggressive totalitarian state run pattern of abuse that has real and serious consequences.
From Anandtech - Yangtze Memory Technologies Co. and UNIC Memory Technology belong to Tsinghua Unigroup, a government-controlled high-tech conglomerate from China.
Anyway now looking at the Crucial P5 or WD SN550. I feel like I'm more likely to be getting what i think I'm getting.
Both the XPG and this Silicon Power SSD are still on the Best SSDs of 2020 but are not the same product that was tested. I think they should be retested as currently sold.


