Team Group MP34 M.2 NVMe SSD Review: A Killer Value
Why you can trust Tom's Hardware
Comparison Products
We'll be comparing the Team Group MP34 against some popular competition. Rocking the same Phison E12 controller as Team Group's drive, we have results from the MyDigitalSSD’s BPX Pro and Gigabyte Aorus RGB. With their own in-house built NVMe controllers, the Samsung 970 EVO Plus and WD’s newly revised Black SN750 represent their respective companies’ latest and top-end products to date. Additionally, we’ve included the SMI SM2262-powered Intel 760p and the Adata XPG SX8200 Pro, the latter of which which features the updated SM2262EN controller. The Crucial P1 features an SMI SM2263 controller and QLC NAND. Finally, we’ve thrown in results from a Samsung 860 EVO to show any advantages these NVMe SSDs have over their SATA-based SSD siblings.
Trace Testing – PCMark 8 Storage Test 2.0
PCMark 8 is a trace-based benchmark that uses Microsoft Office, Adobe Creative Suite, World of Warcraft, and Battlefield 3 to measure the performance of storage devices in real-world scenarios.
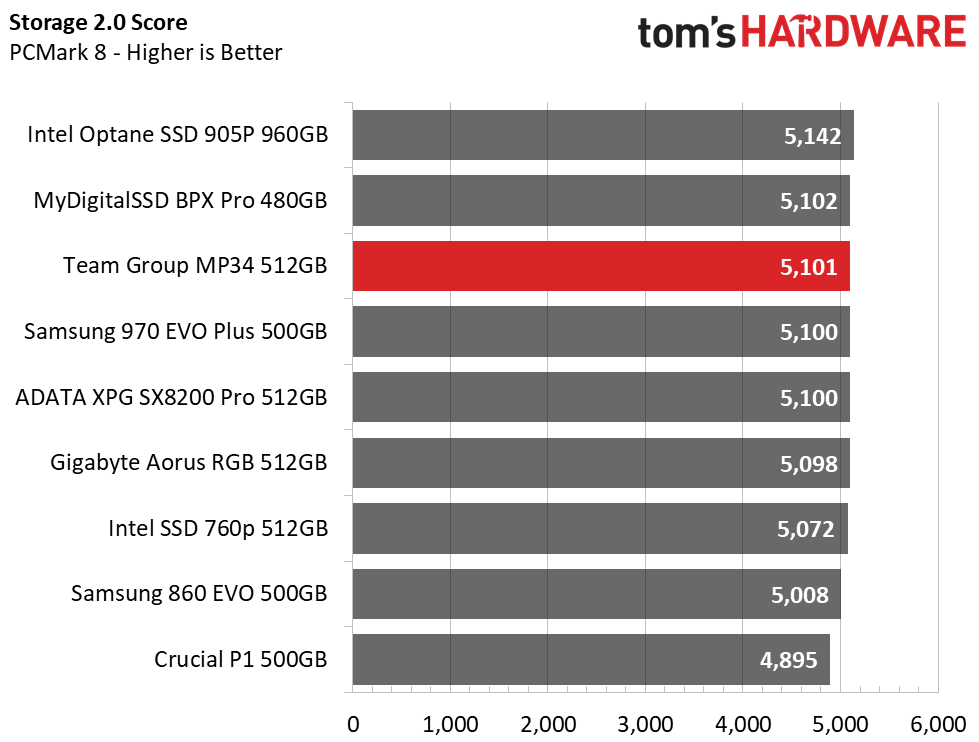
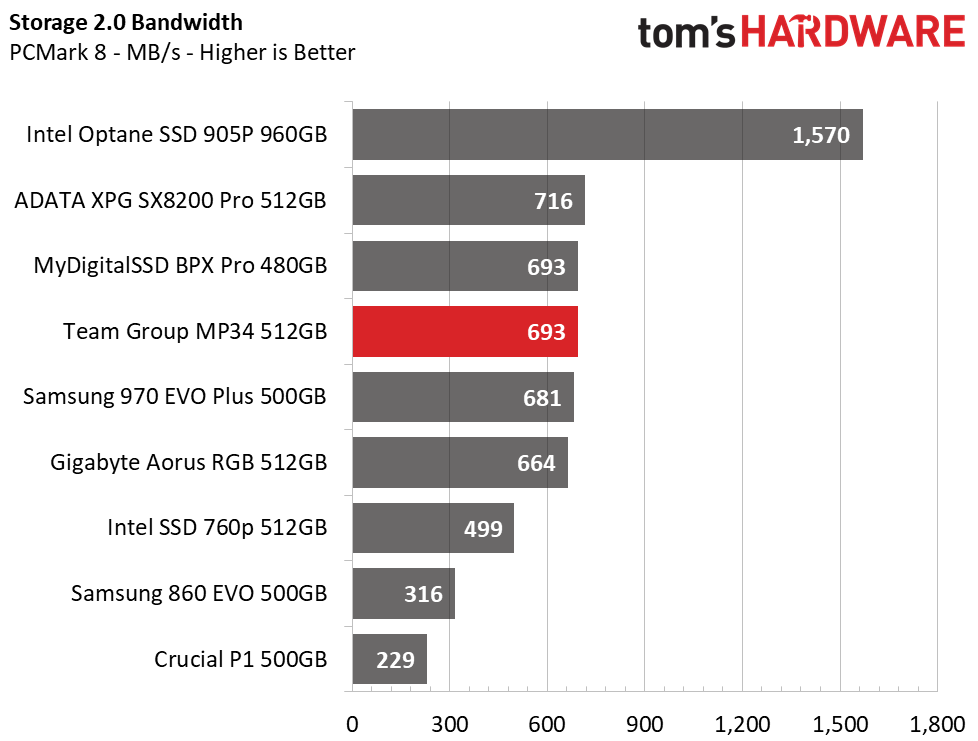
Team Group's MP34 does very good in PCMark 8. With an overall score of 5,101 points and an average bandwidth of 693MB/s, it lands in third place. It even bested Samsung’s 970 EVO Plus by a hair. The MyDigitalSSD BPX Pro was able to edge out with a single point more in score, thanks to its extra over-provisioning, which helps to deliver consistent performance with heavier workloads. But, as we can see, even without overprovisioning, the Team Group MP34 is impressive.
Game Scene Loading - Final Fantasy XIV
The Final Fantasy XIV StormBlood benchmark is a free real-world game benchmark that easily and accurately compares game load times without the inaccuracy of using a stopwatch.
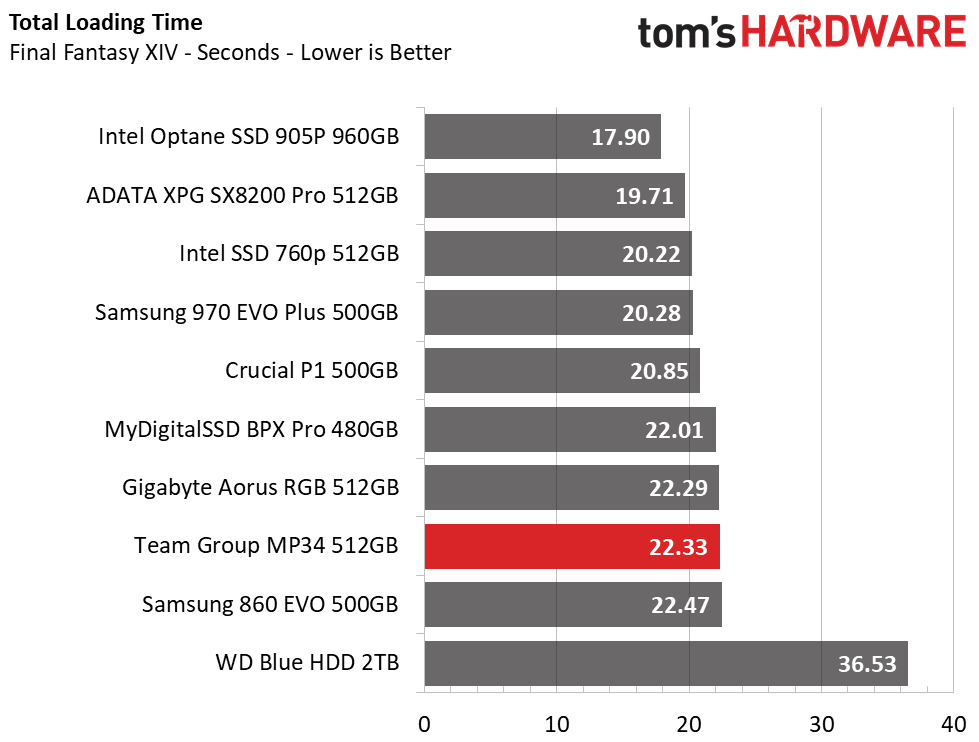
Like the performance in PCMark 8, the MP34 did well in our game load test. It is light-years ahead of any HDD with a total time of 22.33 seconds vs over 36 seconds. The Team Group drive is competitive with other options out there, but overall the difference between one SSD to another, even something of the SATA flavor like Samsung’s 860 EVO, isn’t much.
Transfer Rates – DiskBench
We use the DiskBench storage benchmarking tool to test file transfer performance with our own custom 50GB block of data. Our data set includes 31,227 files of various types, like photos, PDFs, and videos. We copy the files to a new folder and then follow up with a read test of a newly-written 6 GB file.
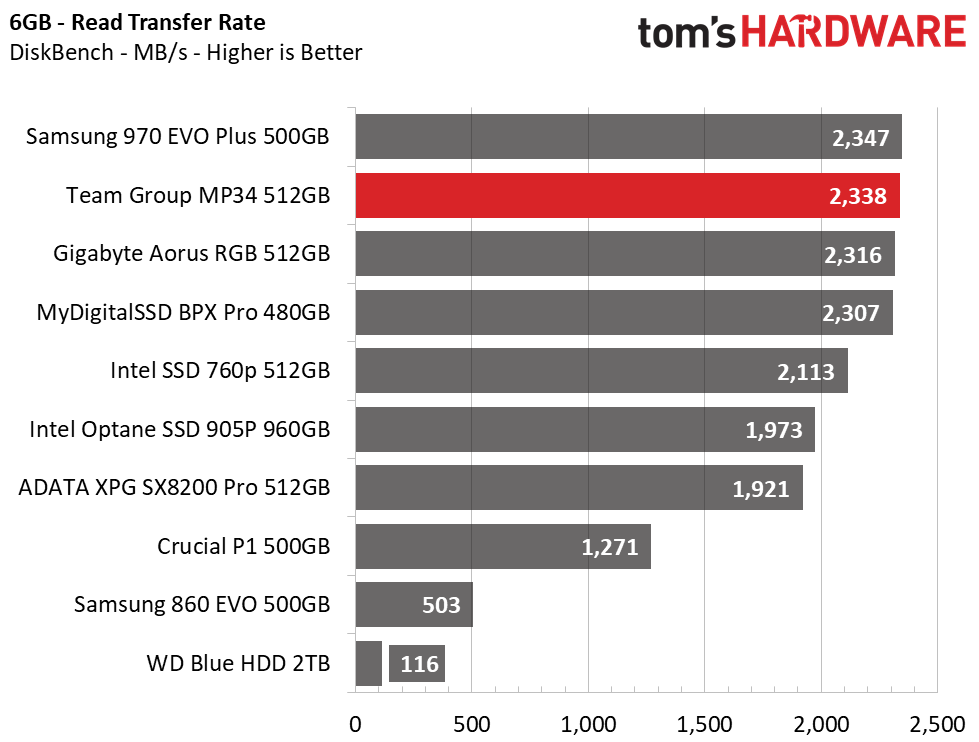
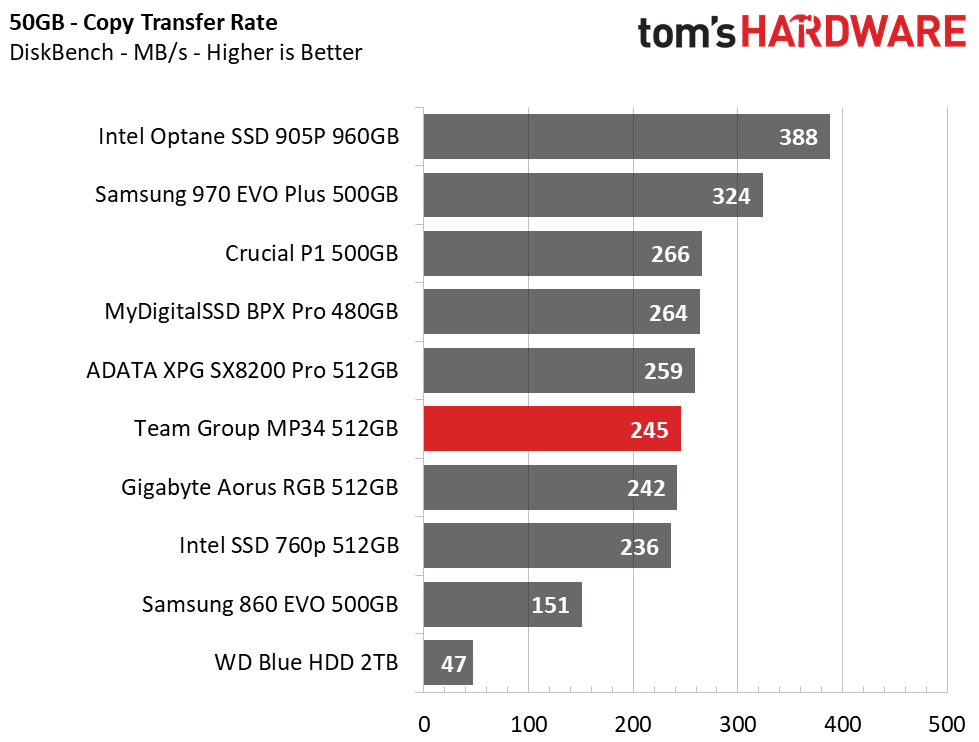
When it comes to file transfer performance, nothing can beat the Intel Optane SSD 905p, but some can come close. The MP34 performed fairly average in our 50GB file copy test. Overall, it ranks in 6th place and bested the Aorus RGB, but was outperformed by the ADATA SX8200 Pro, BPX Pro, Samsung 970 EVO Plus, and even the Crucial P1. In read performance, it did a bit better. It came in close second, just behind the Samsung 970 EVO Plus to read our 6GB test file, and outscored the other E12 based options.
Get Tom's Hardware's best news and in-depth reviews, straight to your inbox.
SYSmark 2014 SE
Like PCMark, SYSmark uses real applications to measure system performance. SYSmark takes things much further, however. It utilizes fourteen different applications to run real workloads with real data sets to measure how overall system performance impacts the user experience. BAPCo's SYSmark 2014 SE installs a full suite of applications for its tests, which includes Microsoft Office, Google Chrome, Corel WinZip, several Adobe software applications, and GIMP. That also makes it a great test to measure the amount of time it takes to install widely-used programs after you install a fresh operating system.
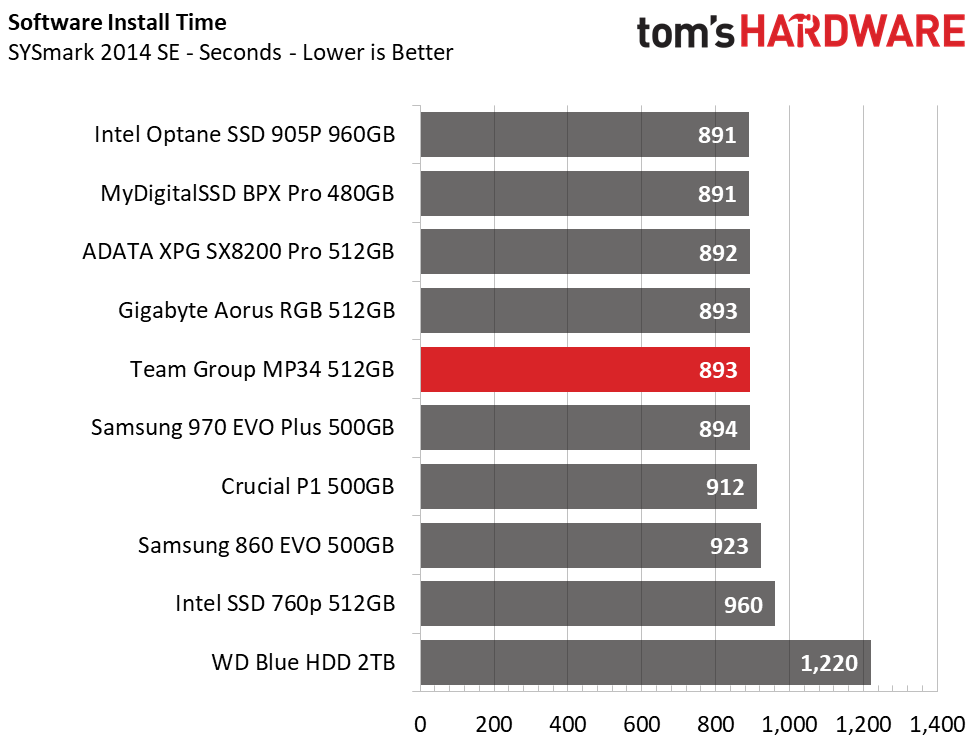
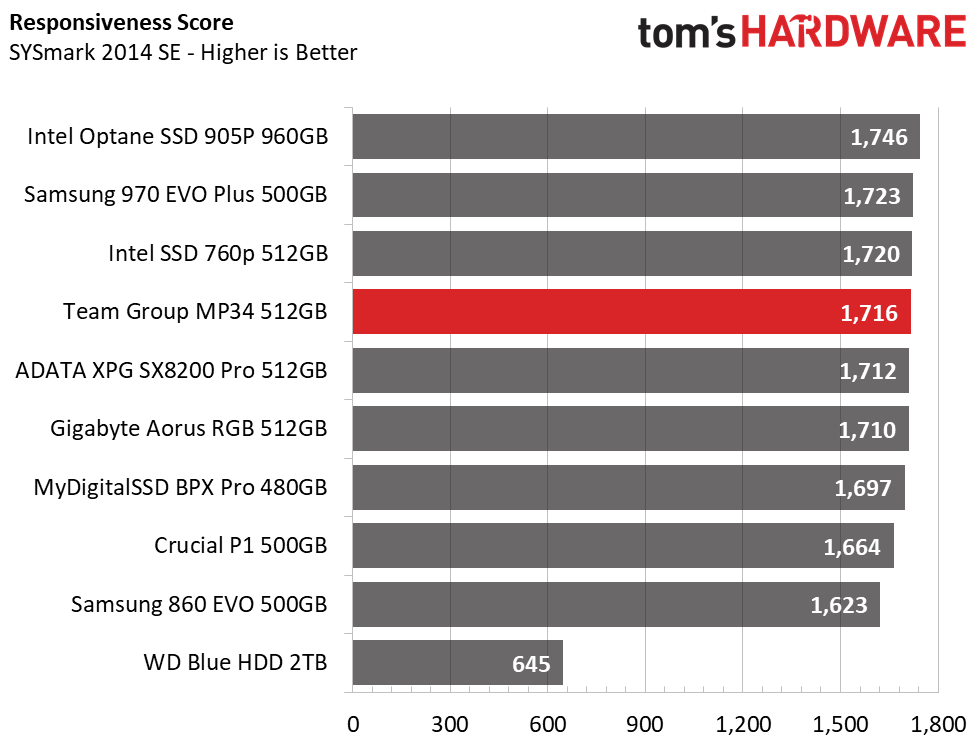
Team Group’s MP34 installed SYSmark 2014 SE without a hitch. It came in fourth place, tying the Aorus RGB, and was only two seconds slower than the Intel 905p. After we put it to the test, it returned a fantastic responsiveness score of 1716 points, which was almost on par with the Intel 760p and Samsung 970 EVO Plus yet again.
ATTO
ATTO is a simple and free application that SSD vendors commonly use to assign sequential performance specifications to their products. It also gives us insight into how the device handles different file sizes.
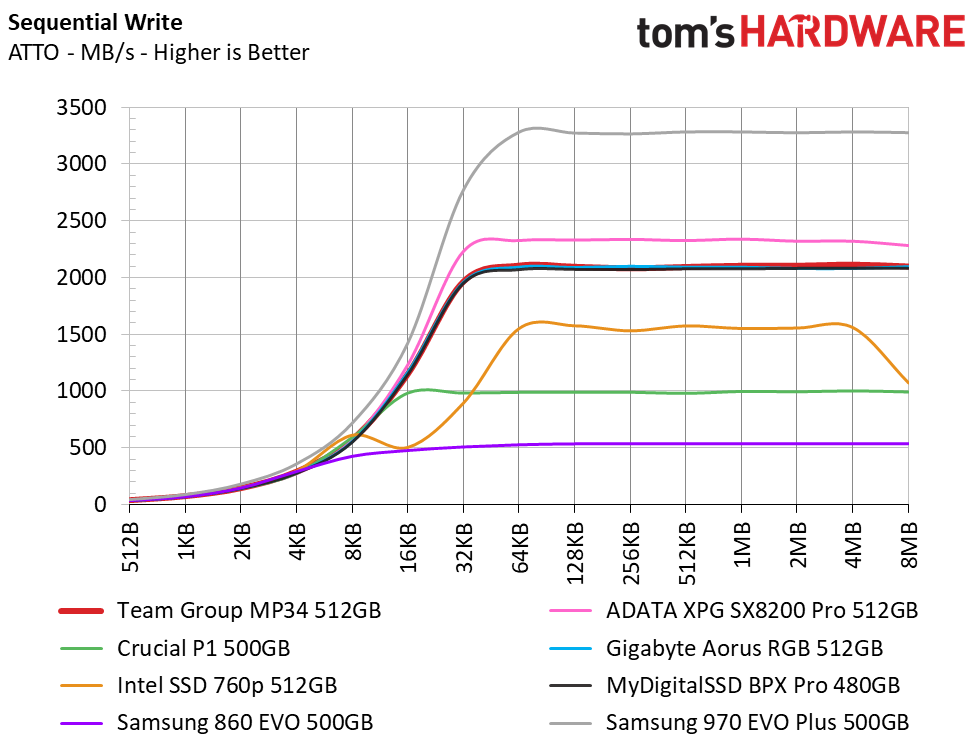
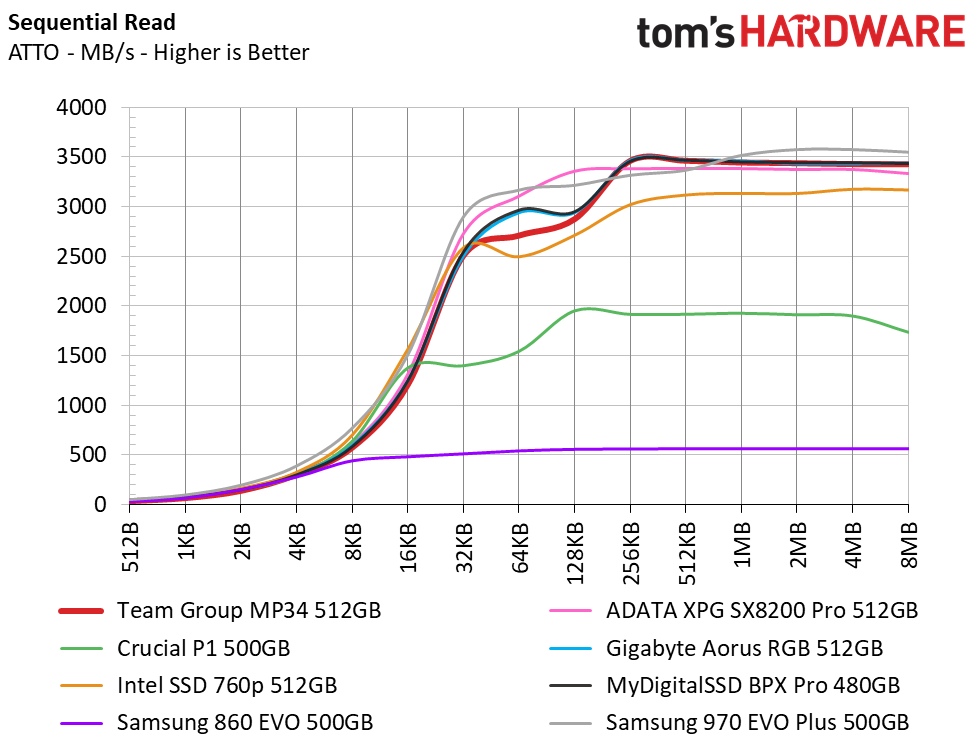
In ATTO, the MP34 delivers essentially the same performance as any other E12 based SSD, up to 3.5/2.1GBps read/write. This outperforms the Crucial P1 and Intel 760p, but the ADATA XPG SX8200 Pro beats it slightly in writes and Samsung’s 970 EVO Plus comes out triumphant with its monster read and write performance.
CrystalDiskMark
CrystalDiskMark (CDM) is a simple and easy to use file size benchmarking tool.
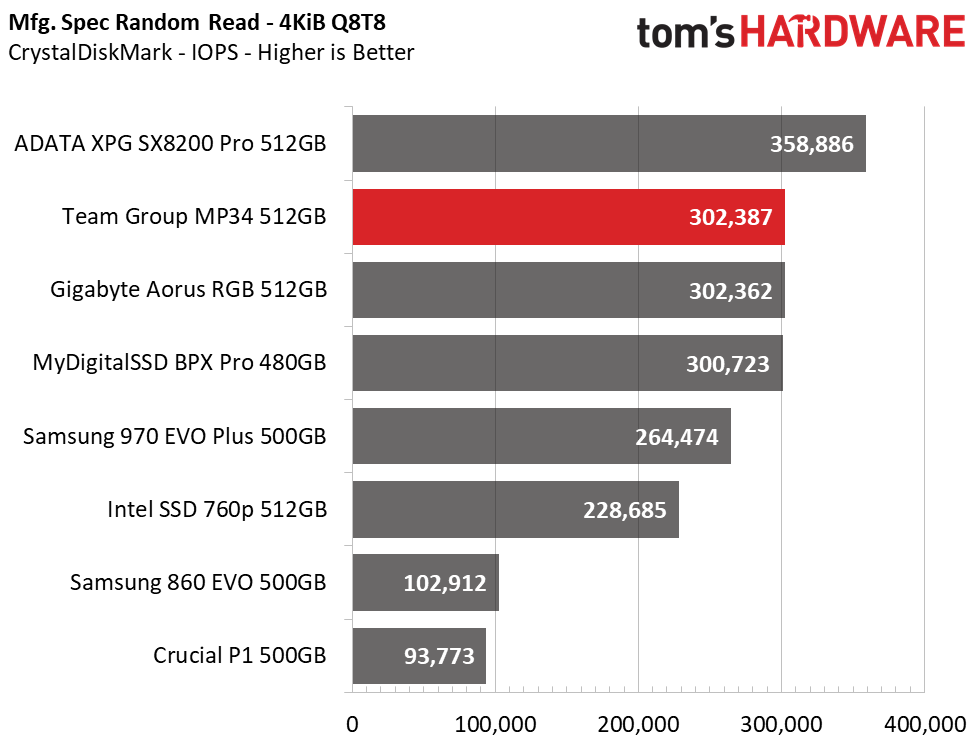
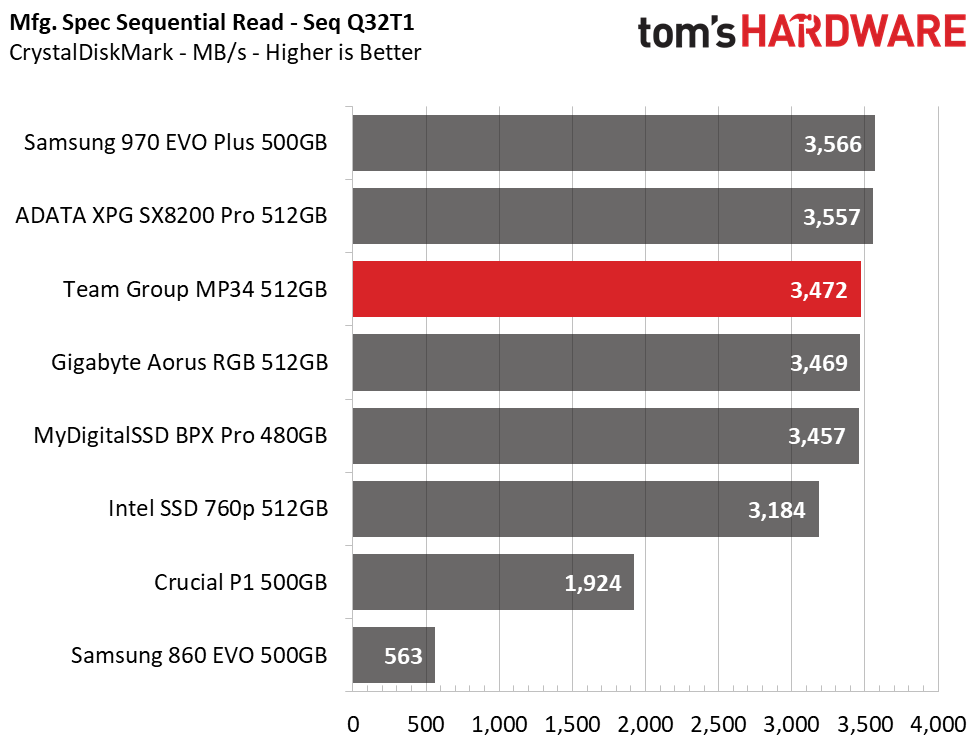
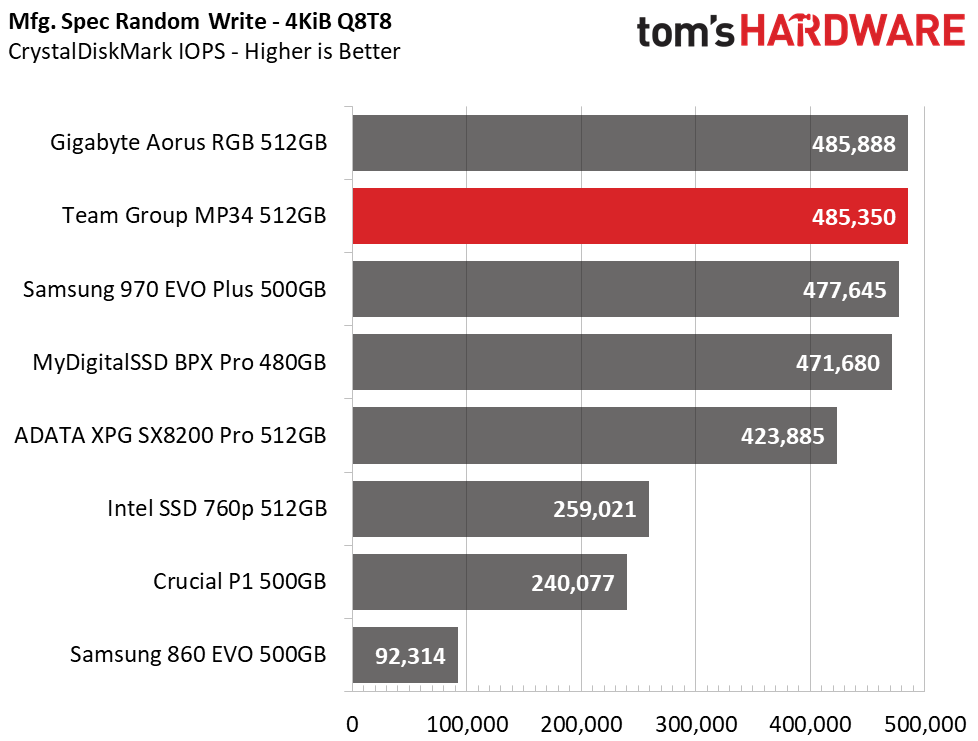
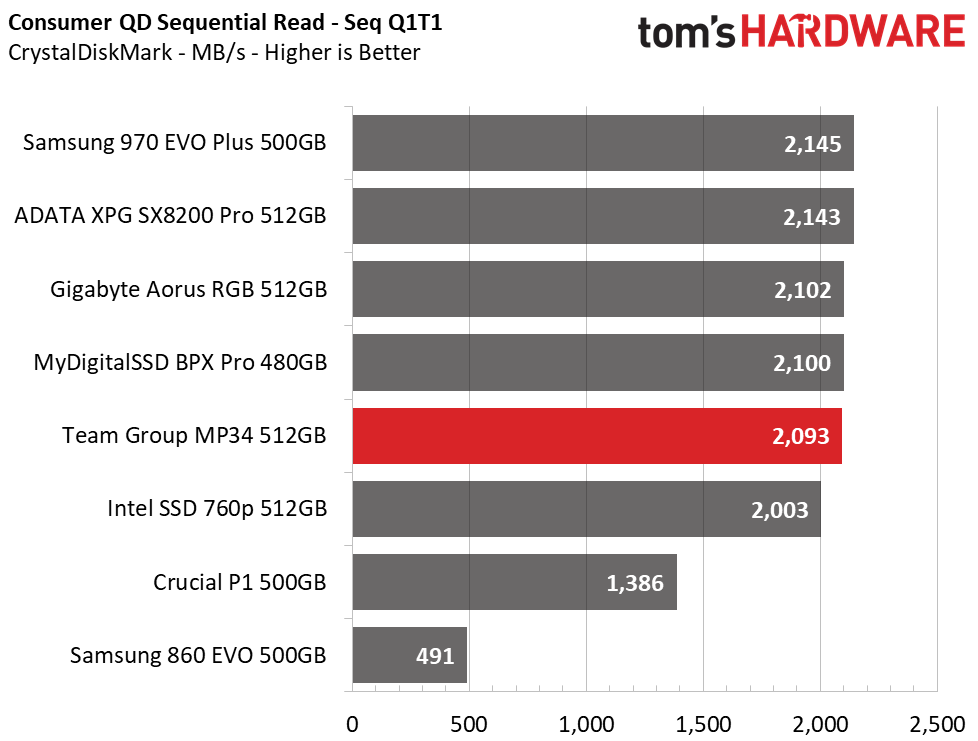
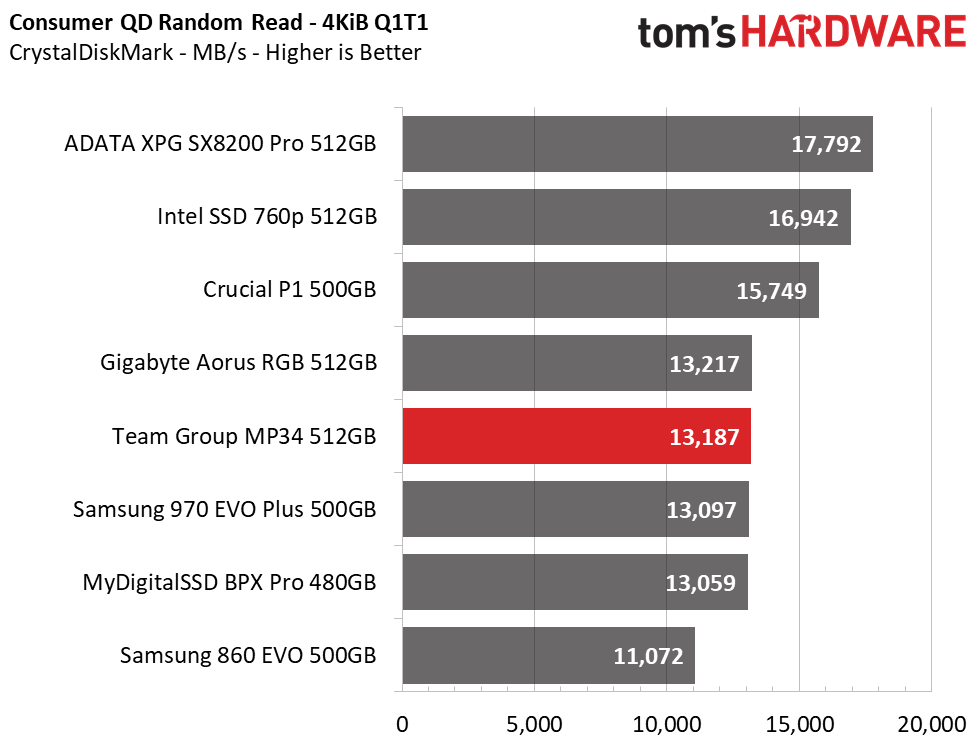
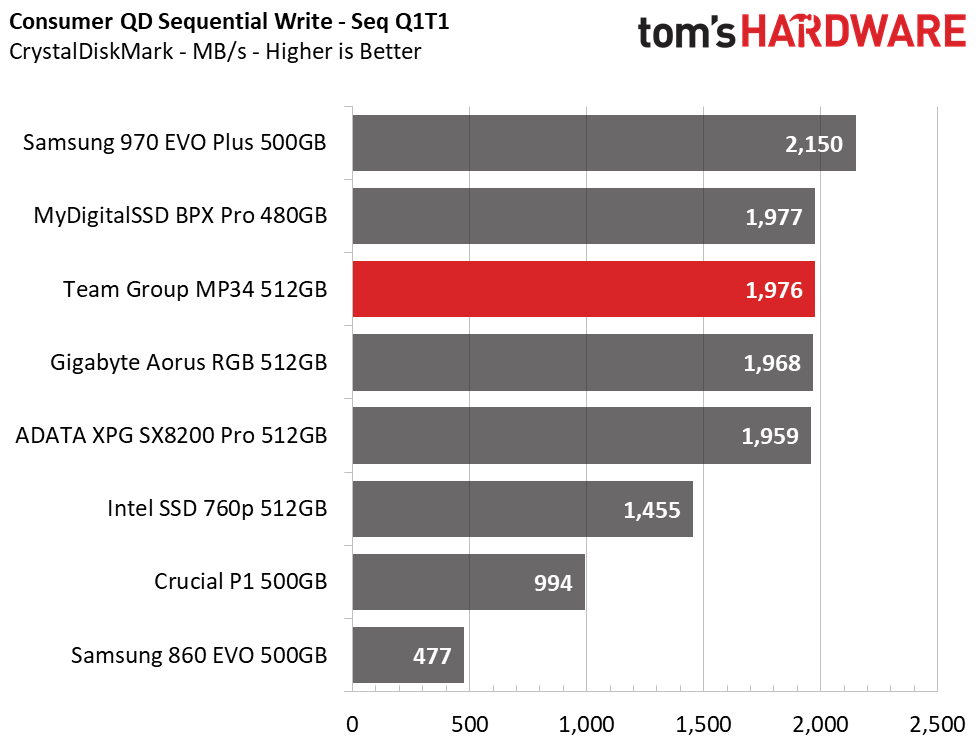
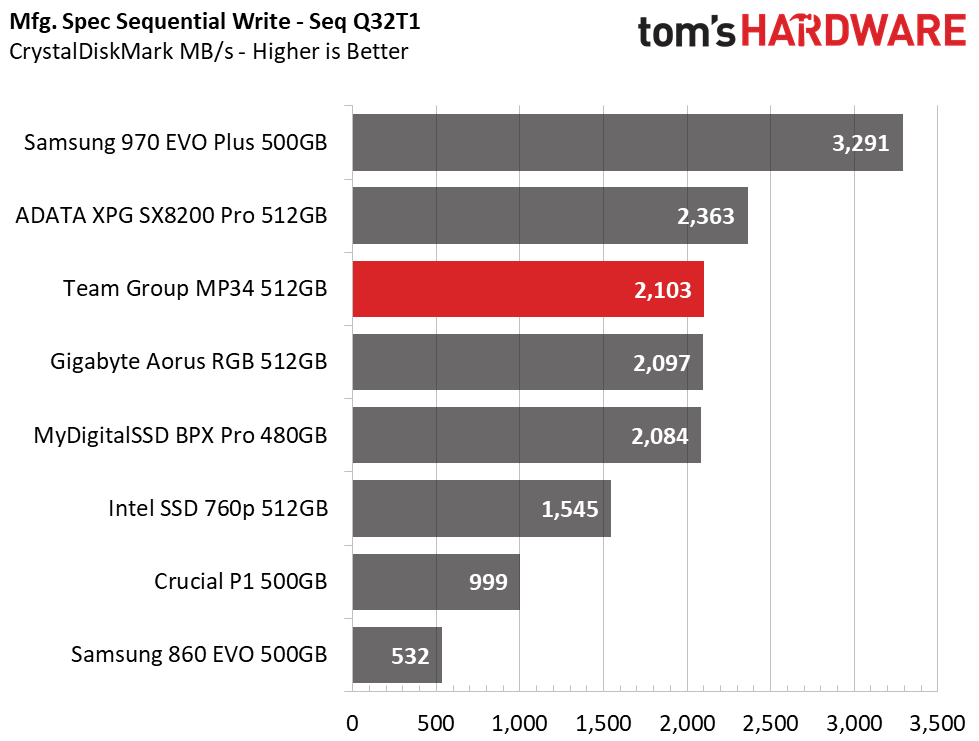
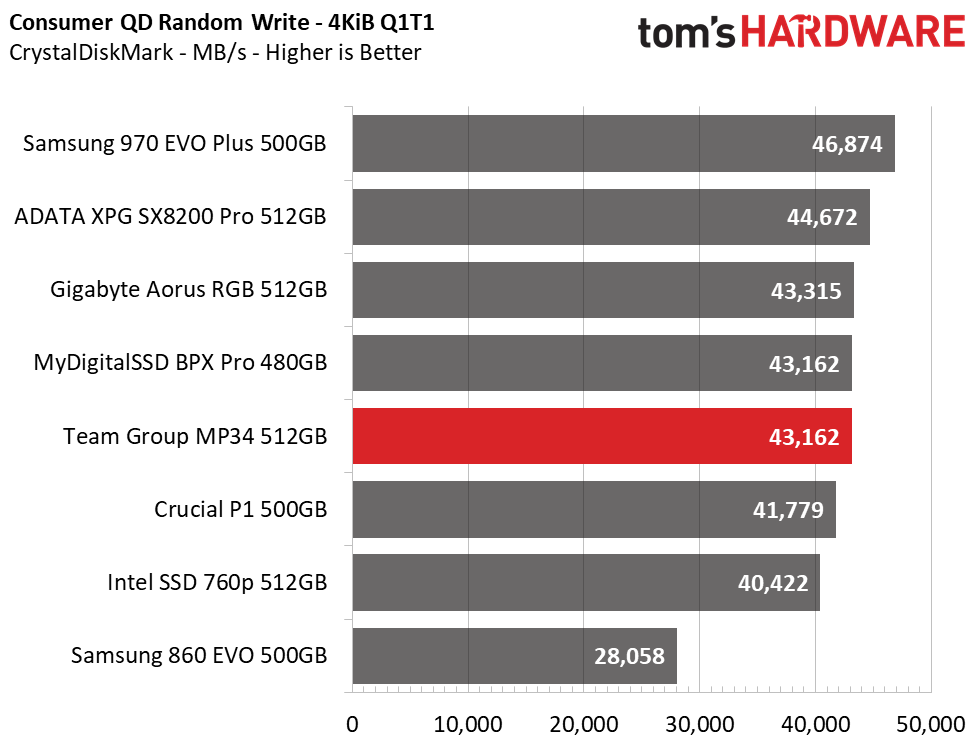
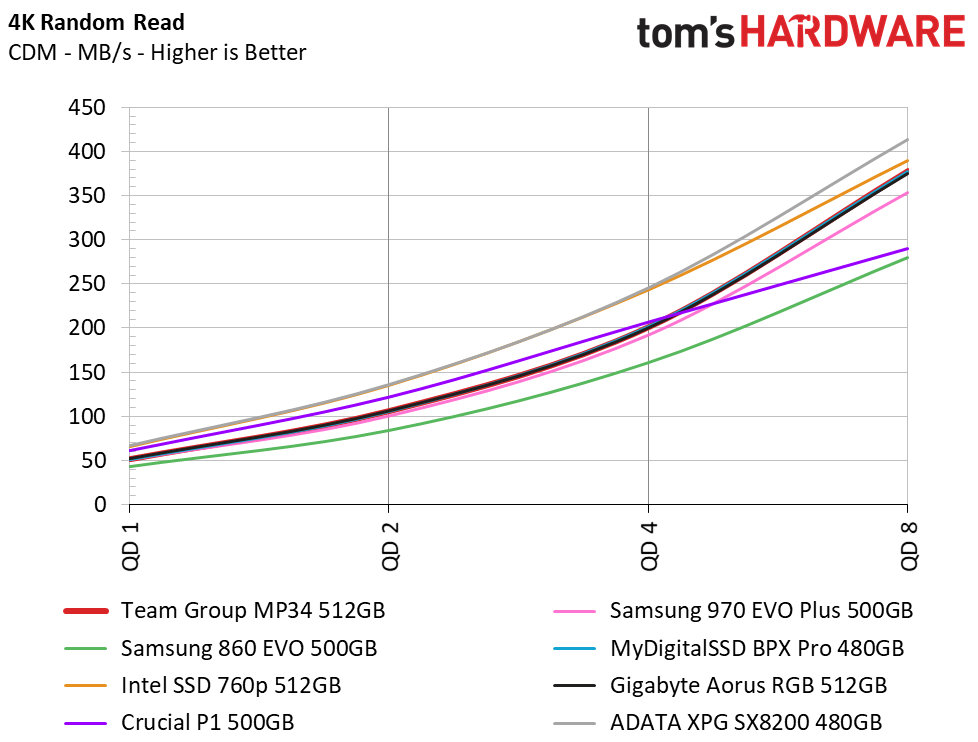
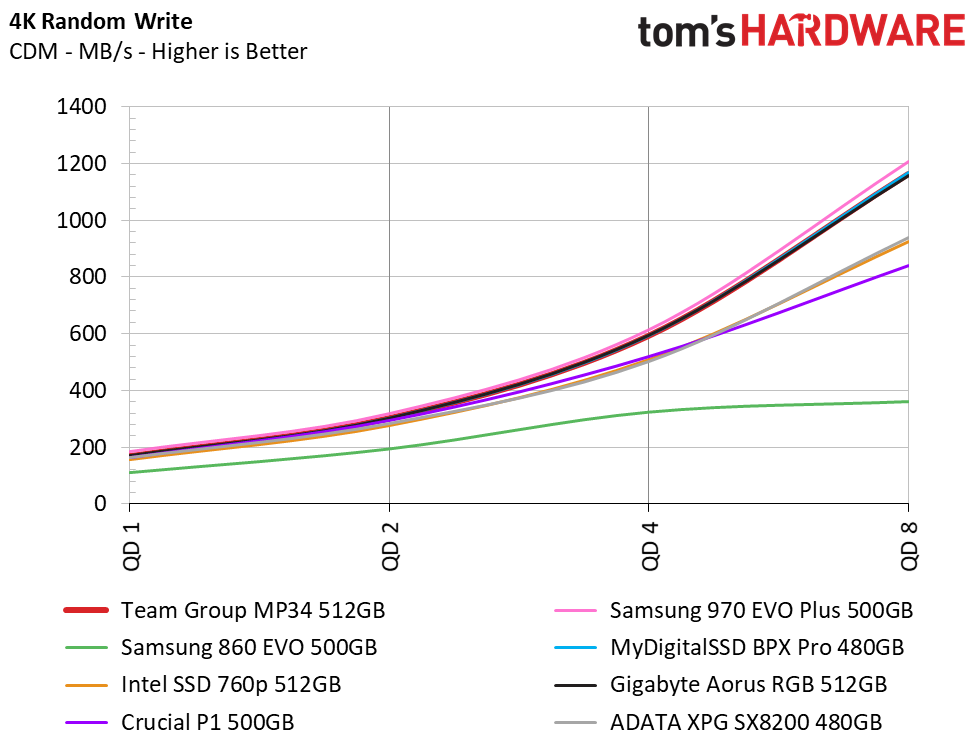
As we saw in ATTO, the MP34 is able to deliver essentially 3.5/2.1GBps read/write speeds. This is at an unrealistically high queue depth of 32, but at a more realistic QD of 1, it does very well too; about 2.1/2.0GBps read/write.
4K random performance, like sequential performance, was very underrated. Rather than only being able to deliver upwards of 190/160K IOP read/write, our tests show it is much more capable. With performance numbers reaching upwards of 302K/485K IOPS read/write, it lands second place in random performance. At more realistic lower QDs, it is fairly average. At QD1 it delivers about 13/43K IOPS read/write.
Sustained Sequential Write Performance
Official write specifications are only part of the performance picture. Most SSD makers implement an SLC cache buffer, which is a fast area of SLC-programmed flash that absorbs incoming data. Sustained write speeds can suffer tremendously once the workload spills outside of the SLC cache and into the "native" TLC or QLC flash. We hammer the SSDs with sequential writes for 15 minutes to measure both the size of the SLC buffer and performance after the buffer is saturated.
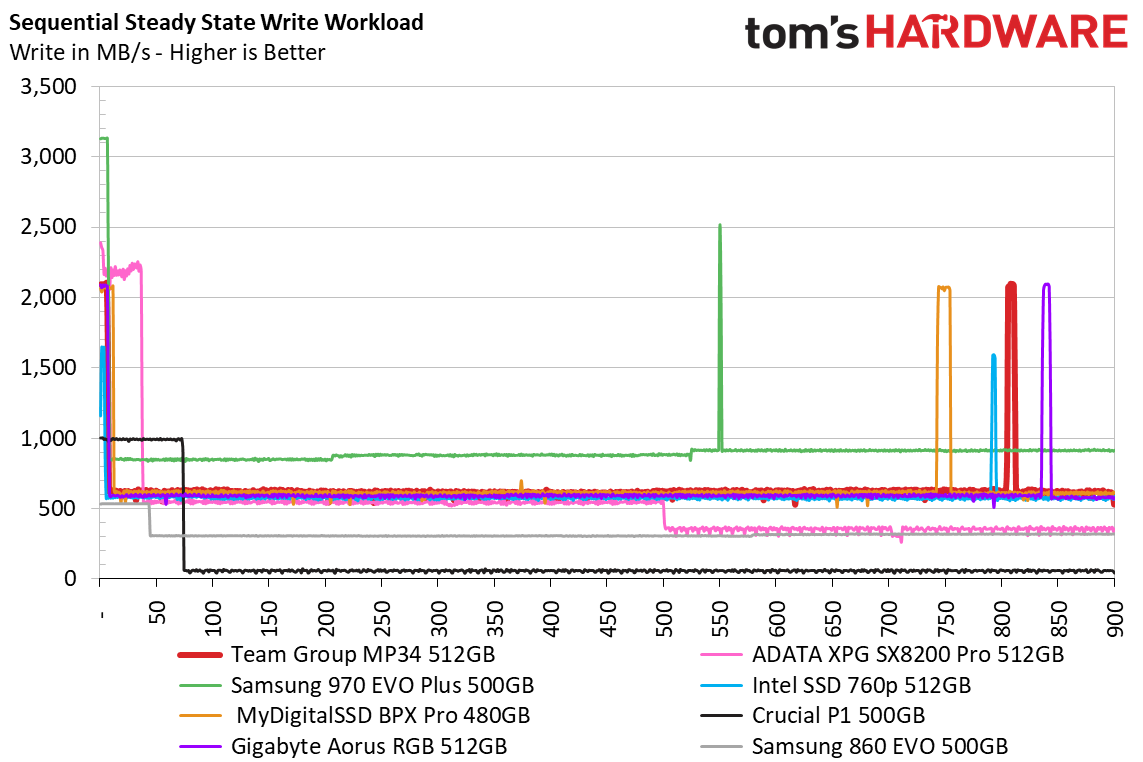
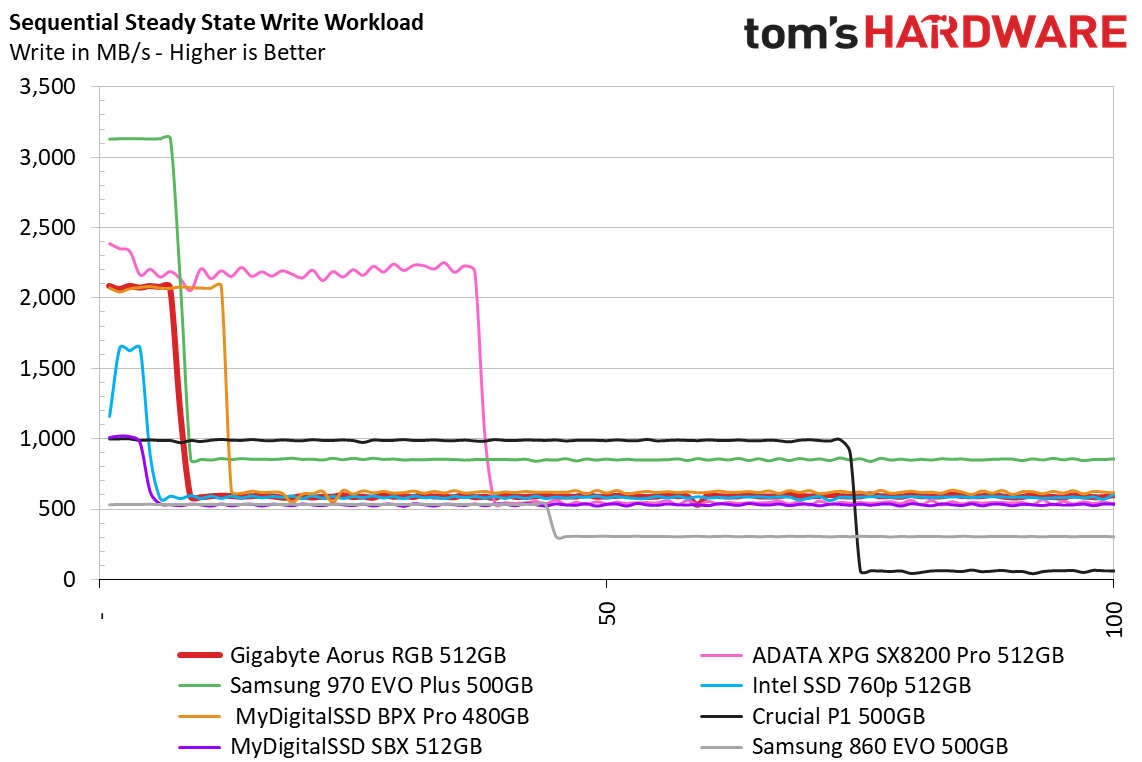
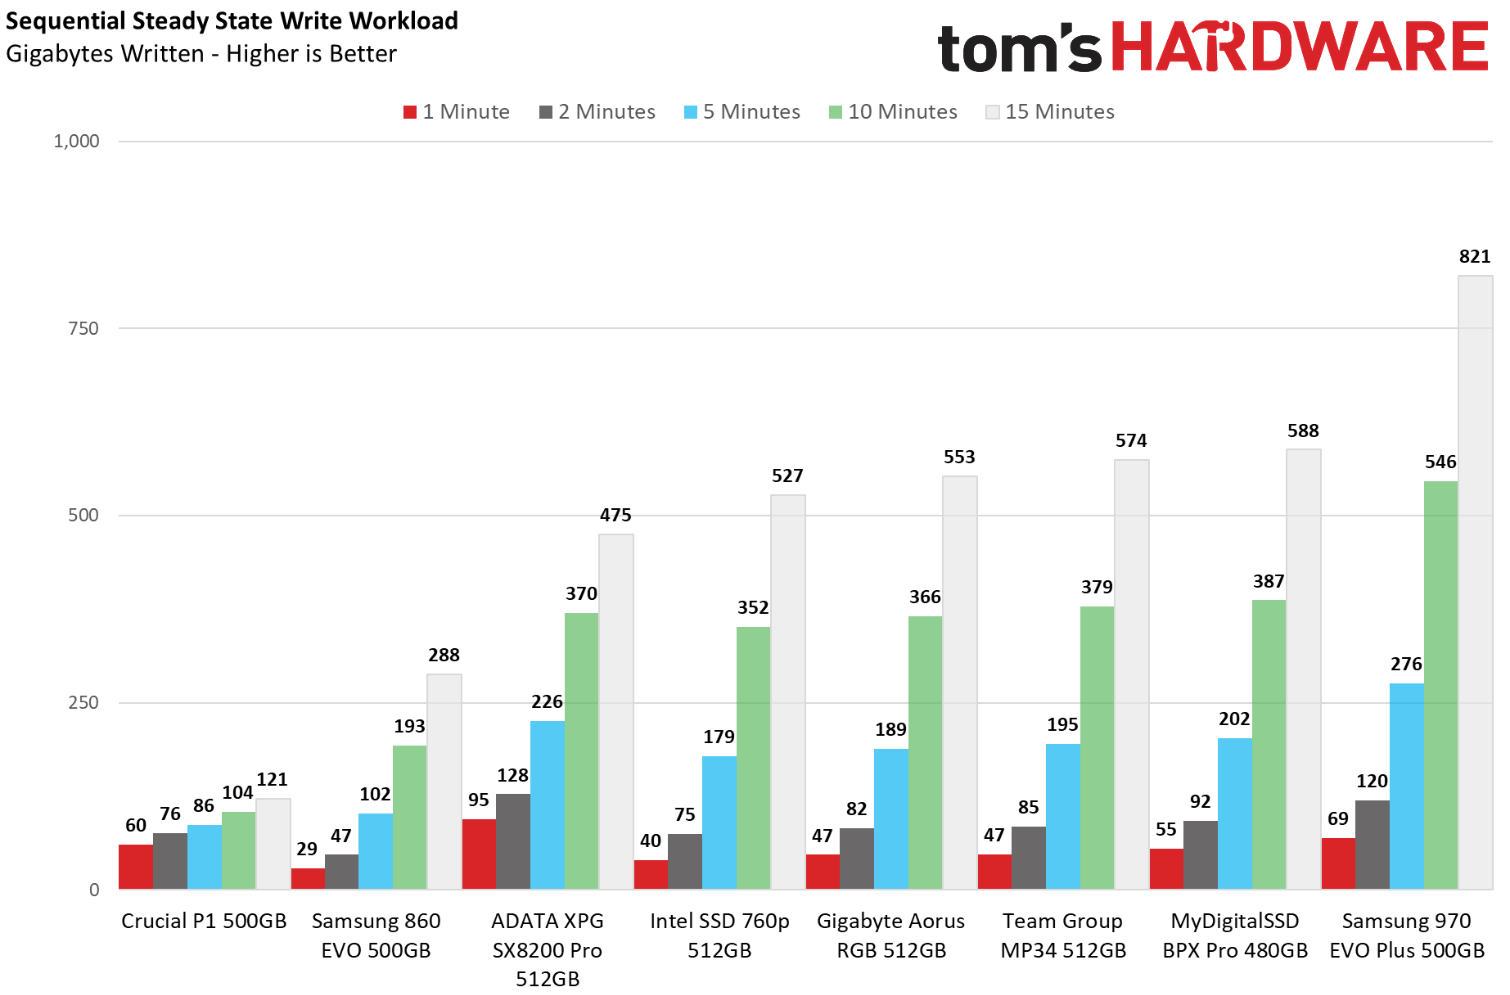
The MP34 would be an odd drive out if it didn’t feature an SLC write cache to help boost write performance. In our testing, it was able to absorb about 12-14GB of data before slowing down from 2.1GBps to an average of 675MB/s. While this is great and ranks it third overall in write performance, the BPX Pro’s SLC cache bests it by giving users an extra 12GB before it slows down.
Power Consumption
We use the Quarch HD Programmable Power Module to gain a deeper understanding of power characteristics. Idle power consumption is a very important aspect to consider, especially if you're looking for a new drive for your laptop. Some SSDs can consume watts of power at idle while better-suited ones sip just milliwatts. Average workload power consumption and max consumption are two other aspects of power consumption, but performance-per-watt is more important. A drive might consume more power during any given workload, but accomplishing a task faster allows the drive to drop into an idle state faster, which ultimately saves power.
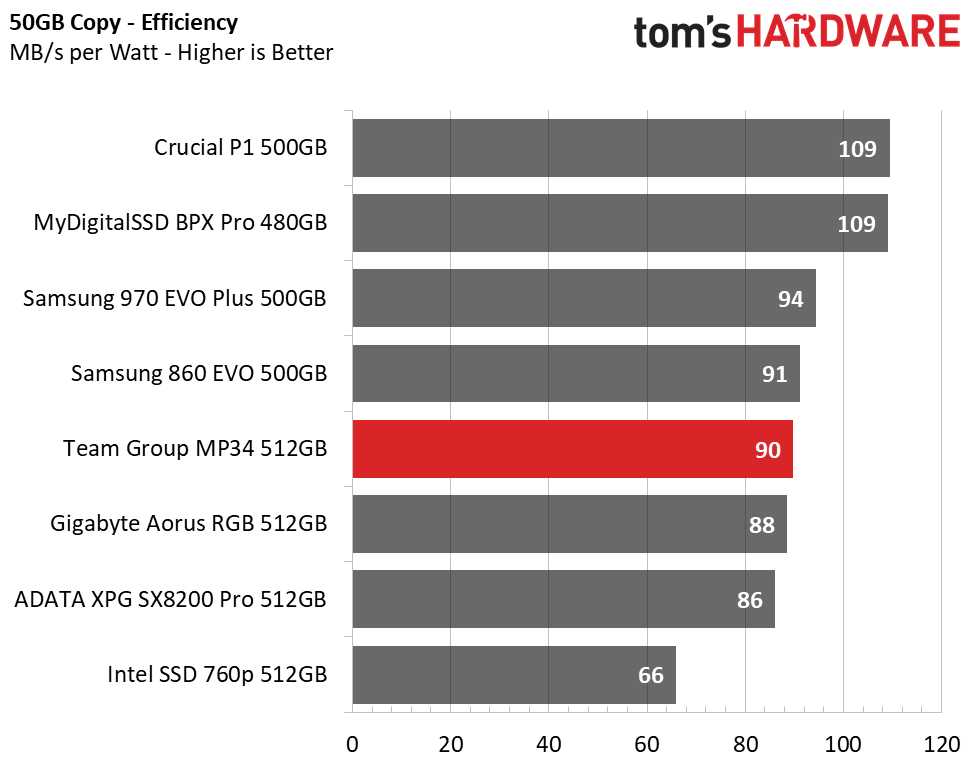
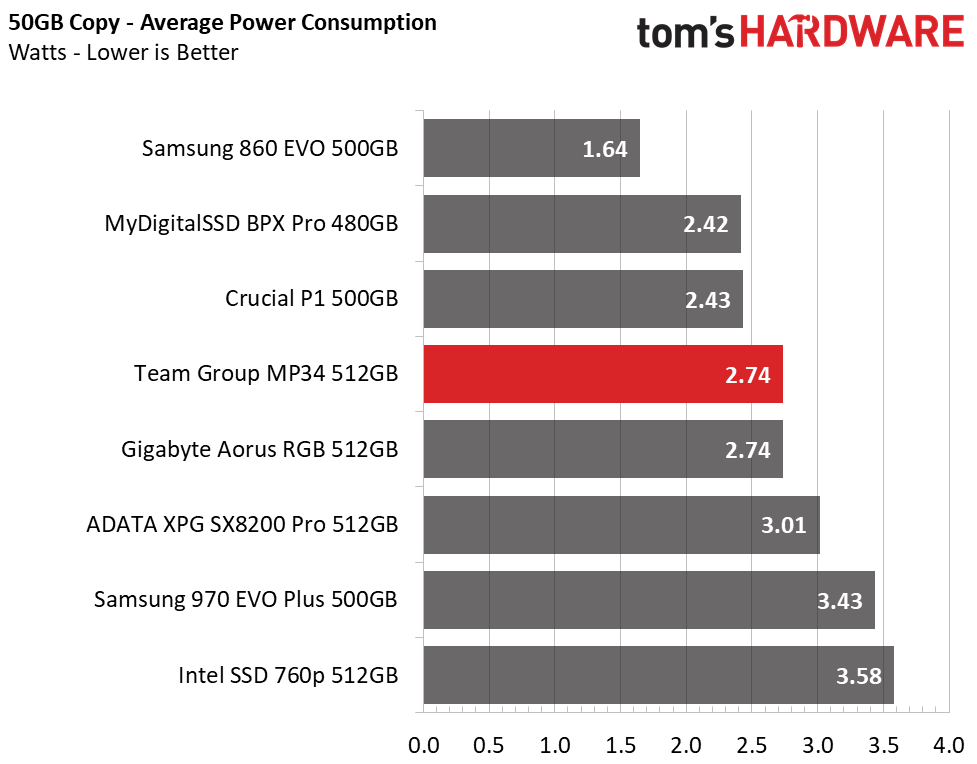
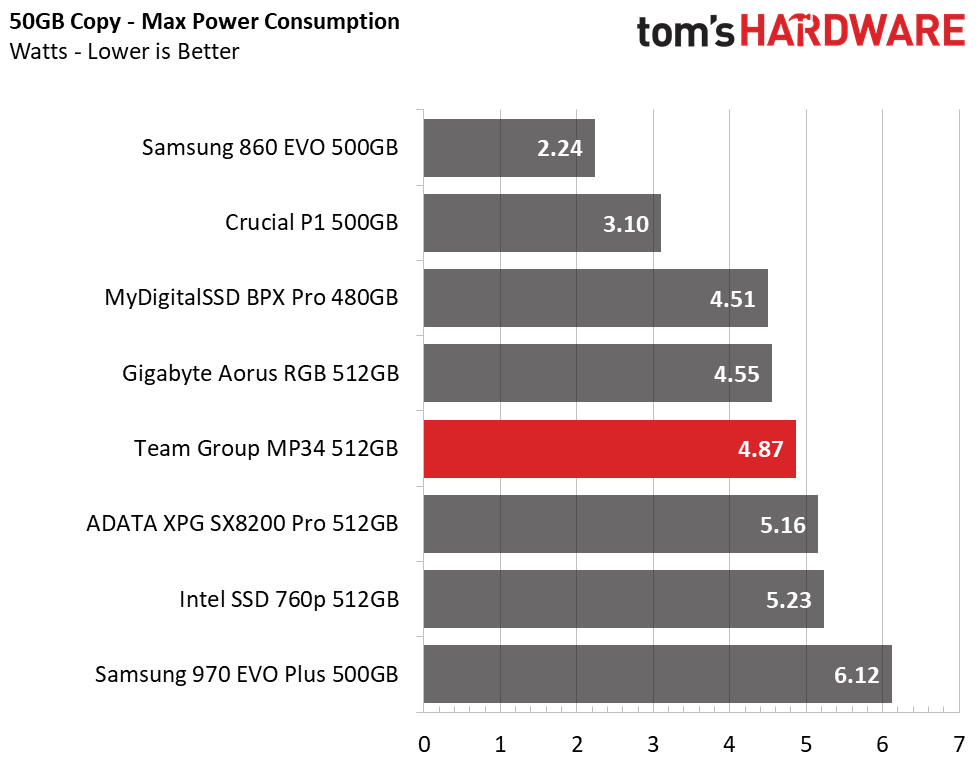
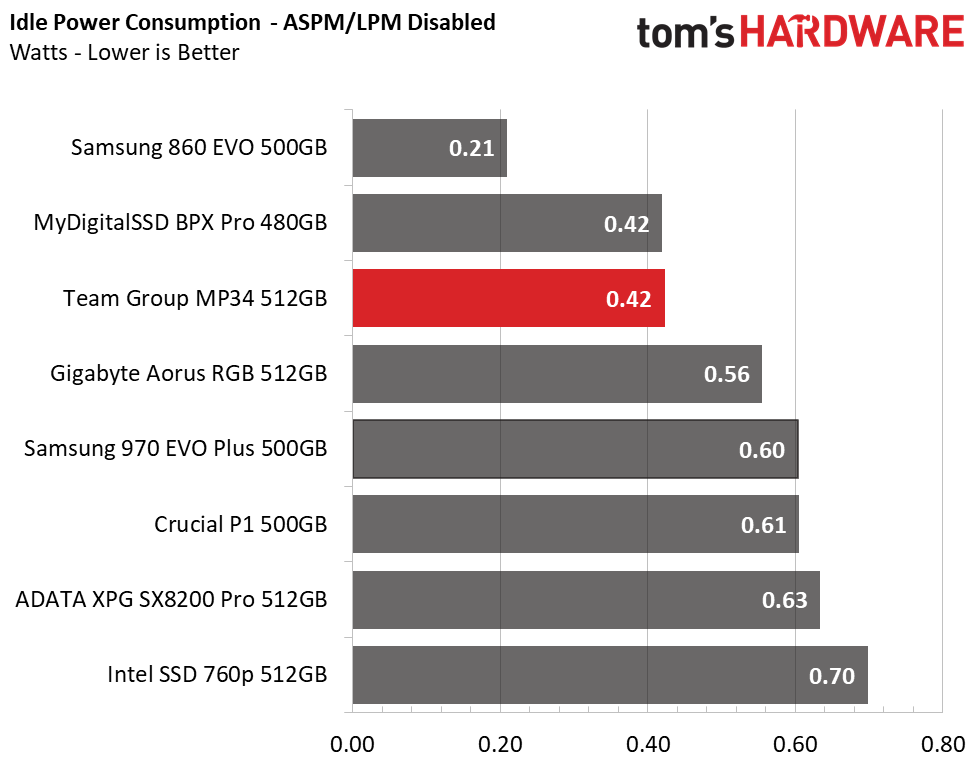
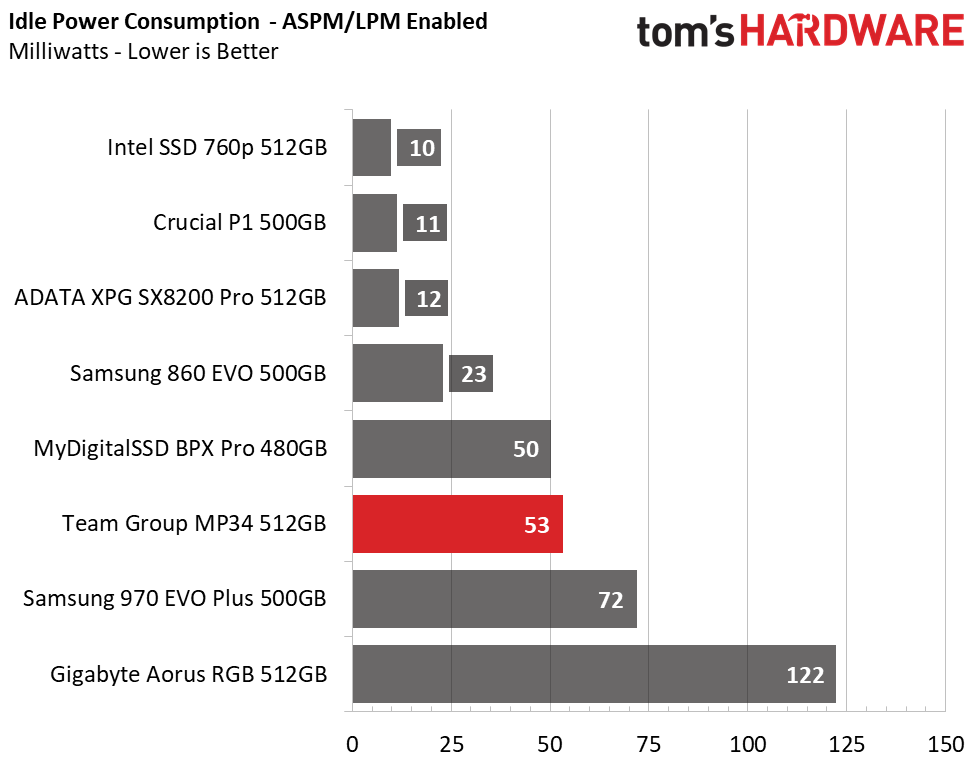
Power consumption is well regulated. Just one thing stands out: During our 50GB file transfer, the drive consumed about the same amount of power as the other E12 based SSDs, but hit a slightly higher maximum. This is probably due to the 1.35v DDR3L DRAM cache rather than the 1.2V DDR4 DRAM cache the others have. Luckily, this didn’t impact its efficiency score, where it averaged 90MBps per watt. As well, at idle it consumes ~0.4W when ASPM is disabled and about 53 milliwatts when it is enabled.
MORE: Best SSDs
MORE: How We Test HDDs And SSDs
MORE: All SSD Content

Sean is a Contributing Editor at Tom’s Hardware US, covering storage hardware.
-
Giroro The drive 476.94 GB to the user, not the 512GB for the "user" in the table.Reply
If their software actually meant, 476.94 GiB, then it why isn't using the correct unit of measurement?
More needs to be done to call out manufacturers on their false advertising on SSD capacities, or at least to educte customers that the numbers on the box don't really mean anything anymore. -
80-watt Hamster ReplyGiroro said:The drive 476.94 GB to the user, not the 512GB for the "user" in the table.
If their software actually meant, 476.94 GiB, then it why isn't using the correct unit of measurement?
More needs to be done to call out manufacturers on their false advertising on SSD capacities, or at least to educte customers that the numbers on the box don't really mean anything anymore.
This is not new. Drive capacity has been measured in multiples of 1000 rather than 1024 for decades. -
Giroro Reply80-watt Hamster said:This is not new. Drive capacity has been measured in multiples of 1000 rather than 1024 for decades.
I am aware of that. Just because it isn't new, doesn't mean we all have to continue to sit by and accept deceptive marketing until the end of time.
Every time we go up in capacity, the difference between the marketing and reality grows larger. -
seanwebster Reply
+180-watt Hamster said:This is not new. Drive capacity has been measured in multiples of 1000 rather than 1024 for decades.
GiB is the correct unit of measurement within Windows, but in my experience, many people confuse GB and GiB, so I usually just go with GB to reduce confusion when reporting Windows usable capacity even though it is technically GiB.
Manufacturers sell drives at a power of 1000 while Windows calculates drives as powers of 1024.
512GB, 500GB, and 480GB capacity SSDs usually all have the same RAW NAND capacity of 512GiB or 549,755,813,888 bytes. Manufacturers overprovision a bit from factory for wear leveling, garbage collection, bad block management, etc. Factory over provisioning varies per device but with our example of 512GB, 500GB, and 480GB SSDs, this means that a drive goes from a usable RAW capacity of 512GiB or 549,755,813,888 bytes to 512GB / 512,000,000,000 bytes, or 500GB / 500,000,000,000 bytes, or 480GB / 48,000,000,000 bytes, which is what the manufacturer sells them as. Windows then reports those capacities as a power of 1024, which converts to ~477GiB / 476,837,158,203 bytes, ~466GiB / 465,661,287,308 bytes, or ~447GiB / 447,034,835,815 bytes.
We report the User capacity / Raw capacity in GB on our charts as to not get people too confused about the whole GiB thing, but I like to include what Windows reports anyways just because to me, it matters since that is what I'm working with within my Windows OS. Other OSes report the capacity in GB, not GiB. -
Mr Marshall Thank you for the quick, to the point, and easily understood article. I personally do not find it being blue PCB being much of an issue. As for me, as long as it isn't green I wouldn't list it as a con. Also, I agree that bringing up the entire argument of listed capacities etc. is beating a dead horse at this point by consumers. I do, however, have a question. If the drive is relatively filled let us say 70-80% does this affect the performance a lot especially when gaming? Sure maybe it isn't as noticeable now with a lack of over-provisioning (theoretically, not sure if you tested this or just an assumption) but I am thinking more in the near future with games going entirely to depend on SSDs of many forms.Reply -
seanwebster Reply
It shouldn't affect read performance at all in your application...gaming is nearly all reads. Nor should that affect write performance since the SLC cache is a static size. All my testing is done with the SSD being used as the OS drive and 50% full as it is. (except the 15minutes write test which is done after a secure erase.)Mr Marshall said:Thank you for the quick, to the point, and easily understood article. I personally do not find it being blue PCB being much of an issue. As for me, as long as it isn't green I wouldn't list it as a con. Also, I agree that bringing up the entire argument of listed capacities etc. is beating a dead horse at this point by consumers. I do, however, have a question. If the drive is relatively filled let us say 70-80% does this affect the performance a lot especially when gaming? Sure maybe it isn't as noticeable now with a lack of over-provisioning (theoretically, not sure if you tested this or just an assumption) but I am thinking more in the near future with games going entirely to depend on SSDs of many forms.
70-80% full won't make much of a difference. The only time it does is when drives feature dynamic caches. They will have a smaller SLC write cache when fuller with data, although many also have a static SLC cache in place to guarantee high burst write performance, which is plenty for most consumer applications. -
davrob01 Team Group has recently extended the warranty on this SSD model to 5 years. Making it an even better deal!Reply
Sources:
https://www.teamgroupinc.com/en/product/mp34
https://www.amazon.com/TEAMGROUP-MP34-512GB-Solid-TM8FP4512G0C101/dp/B07PHMJR4Y

