Why you can trust Tom's Hardware
Comparison Products
We put Team Group’s T-Force Cardea A440 up against the Best SSDs on the market. These include the Seagate FireCuda 530, Samsung 980 Pro, WD Black SN850. We also threw in the Mushkin Gamma, Gigabyte Aorus Gen4 7000s, Sabrent Rocket 4 Plus, and Patriot Viper VP4300 for good measure.
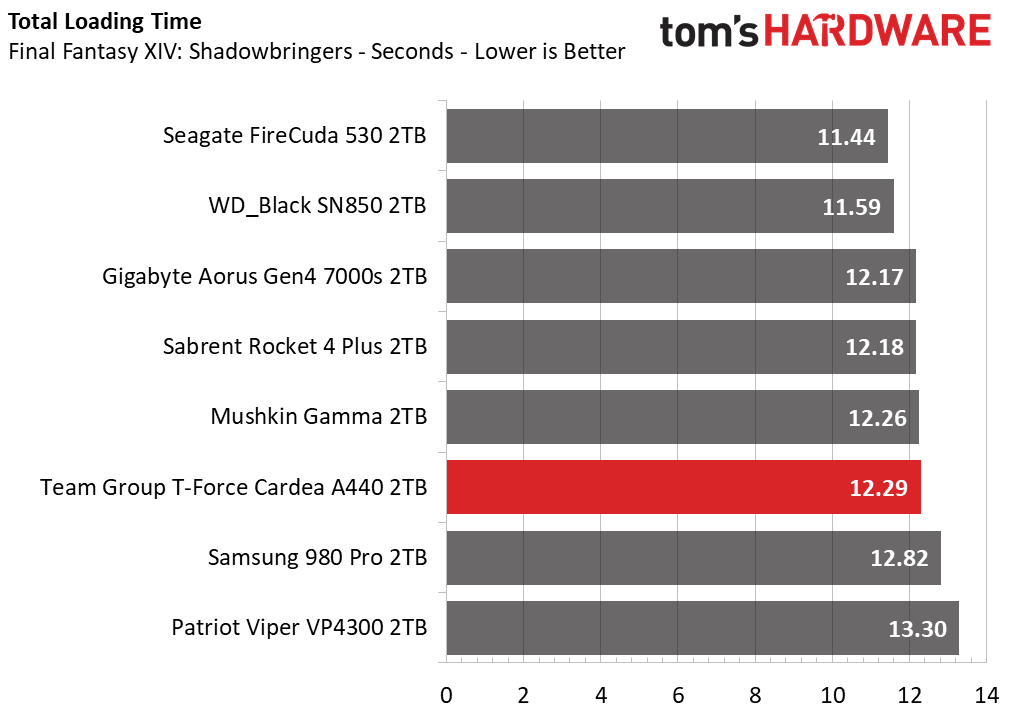
Game Scene Loading - Final Fantasy XIV
Final Fantasy XIV Shadowbringers is a free real-world game benchmark that easily and accurately compares game load times without the inaccuracy of using a stopwatch.
Hanging with many of the other Phison E18 NVMe-based SSDs in our test pool, the T-Force Cardea A440 delivered a fast total load time. It beat the Samsung 980 Pro and Patriot Viper VP4300, but both Seagate’s FireCuda 530 and WD Black SN850 proved a bit more responsive.
Transfer Rates – DiskBench
We use the DiskBench storage benchmarking tool to test file transfer performance with a custom dataset. We copy a 50GB dataset including 31,227 files of various types, like pictures, PDFs, and videos to a new folder and then follow-up with a reading test of a newly-written 6.5GB zip file.
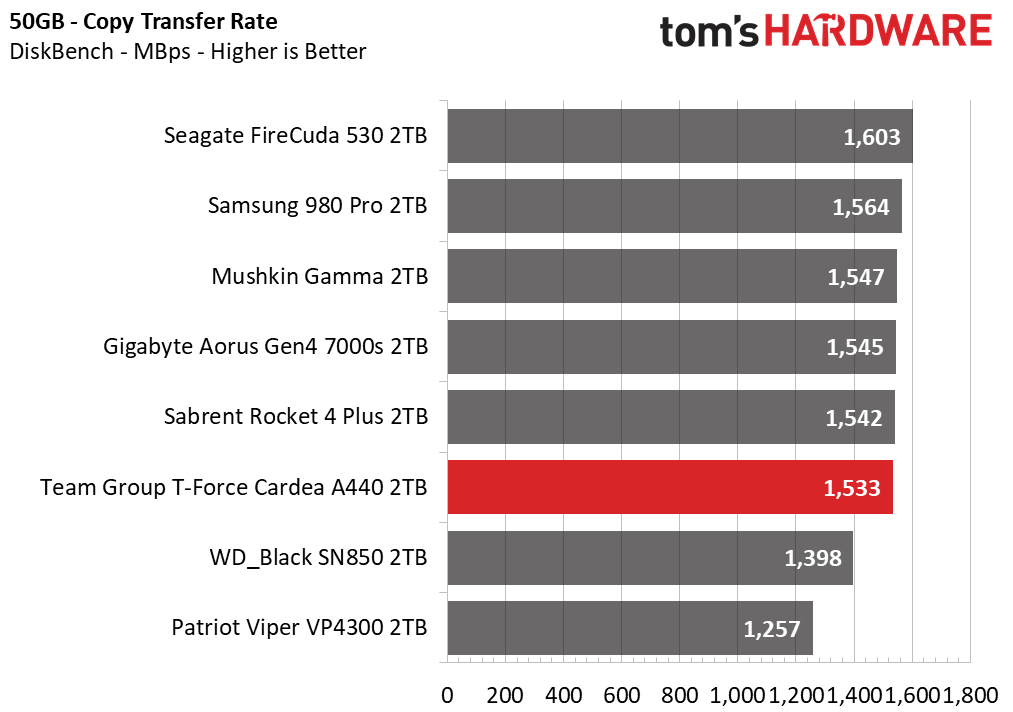
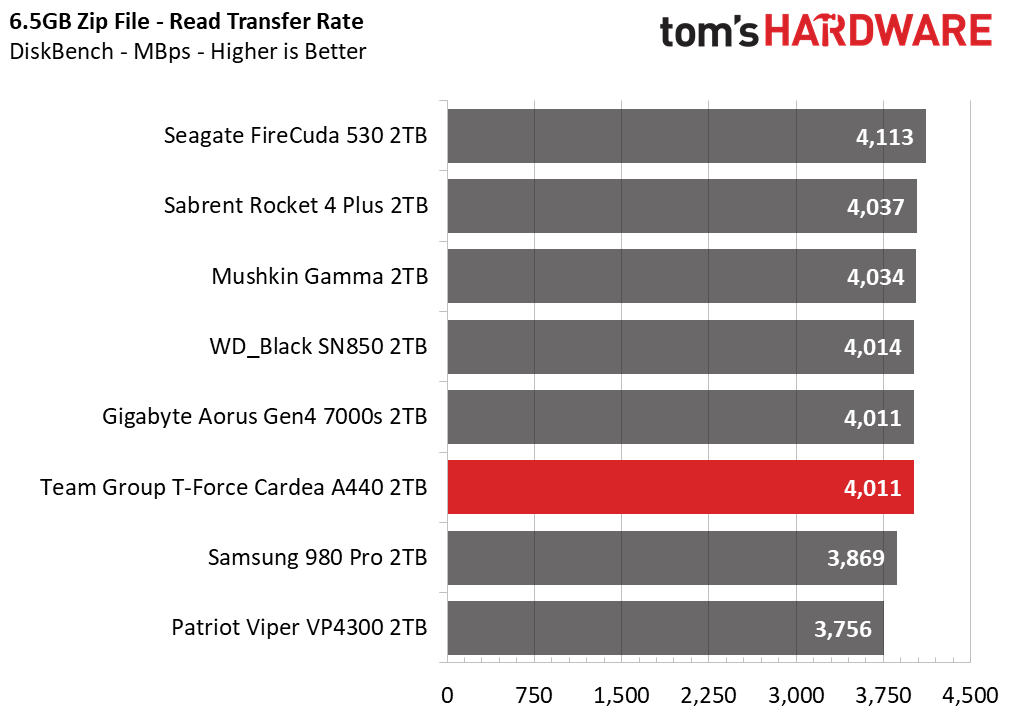
In terms of its file copy performance, the A440 scored average among its competition. It managed to outperform the WD Black SN850 and Patriot Viper VP4300 when copying our many test files and outperformed the Samsung 980 Pro in reading back our large .zip file.
Trace Testing – PCMark 10 Storage Test
PCMark 10 is a trace-based benchmark that uses a wide-ranging set of real-world traces from popular applications and everyday tasks to measure the performance of storage devices. The quick benchmark is more relatable to those who use their PCs for leisure or basic office work, while the full benchmark relates more to power users.
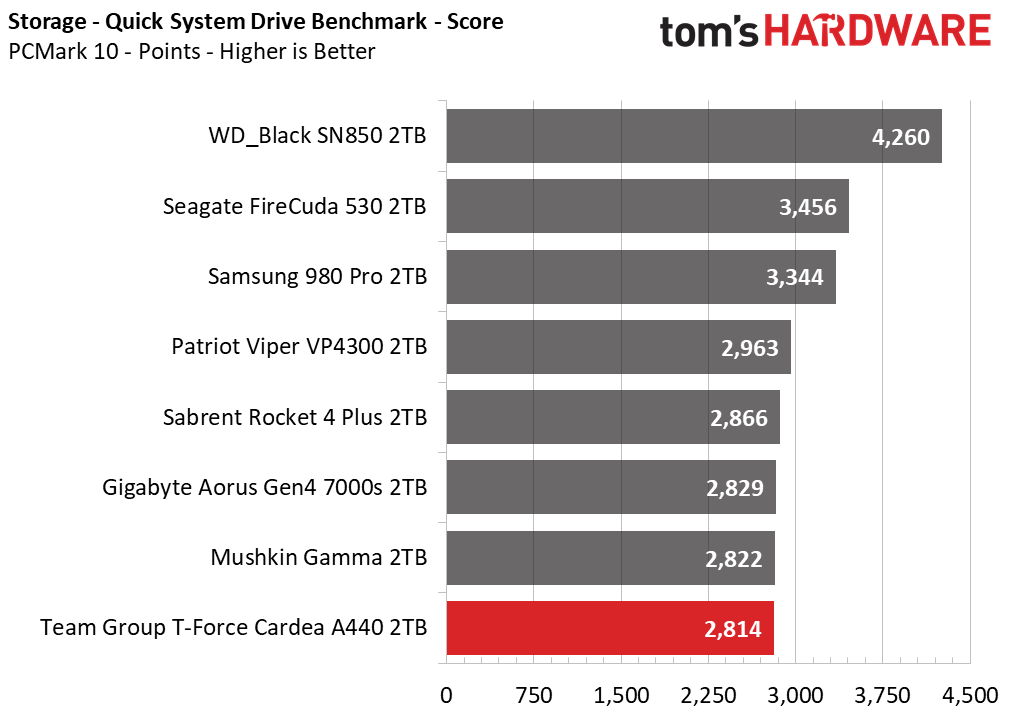
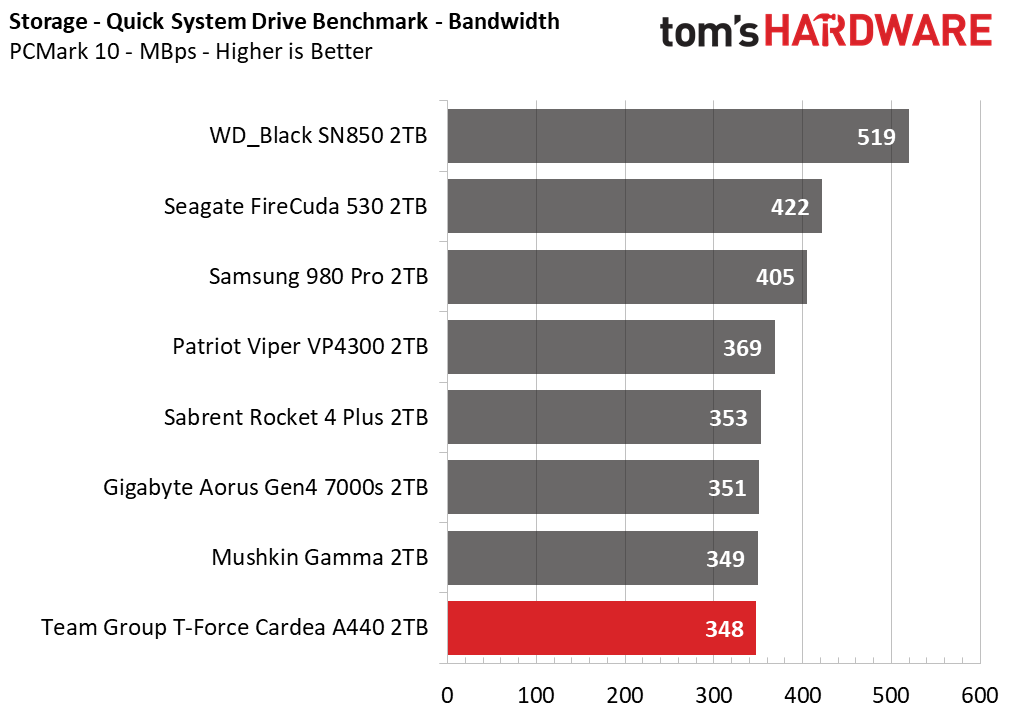
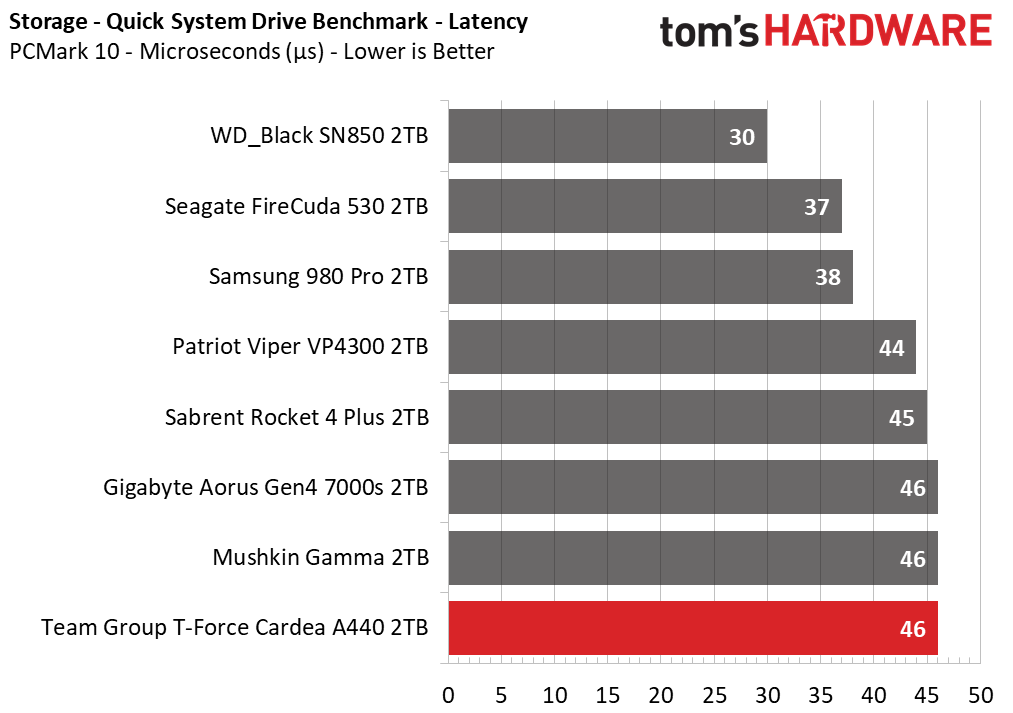
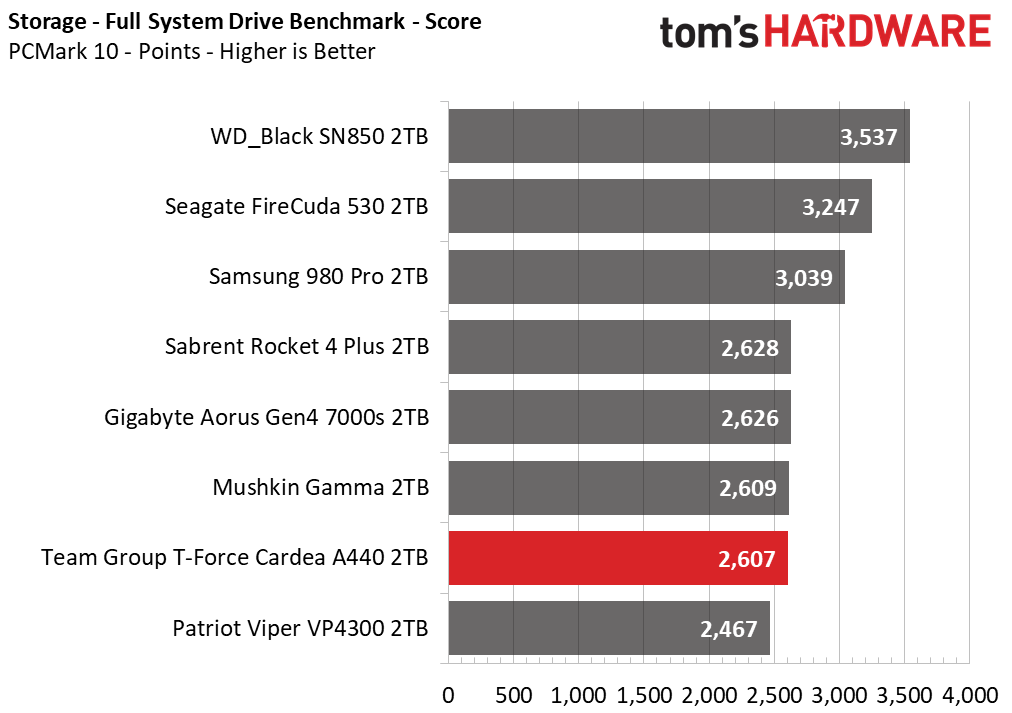
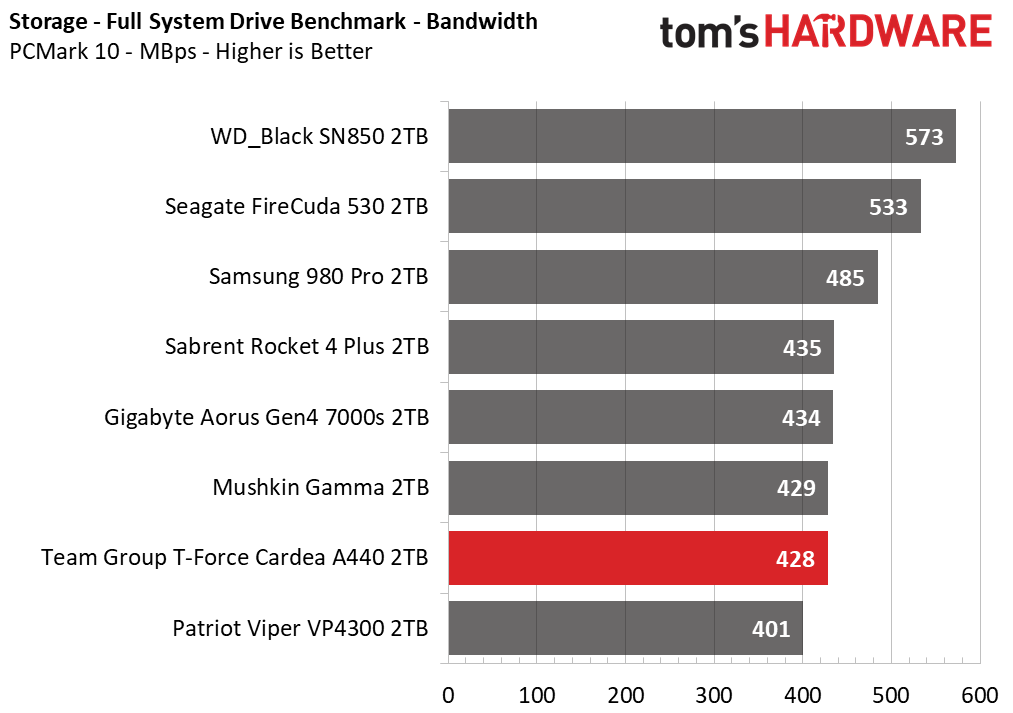
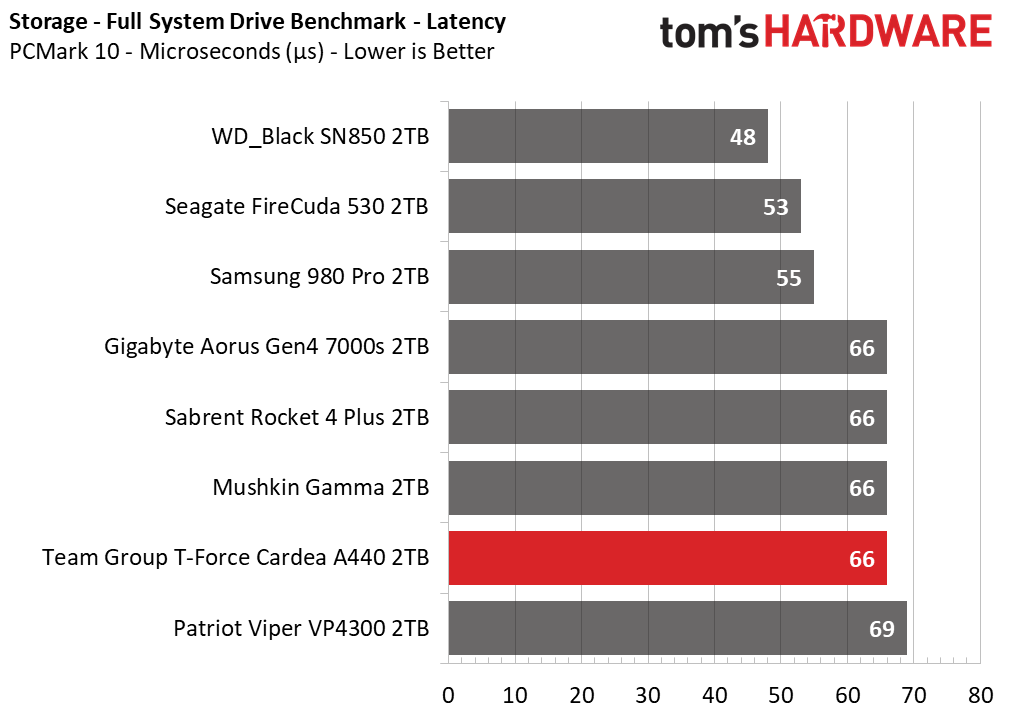
In PCMark 10, the A440 is one of the least-responsive in this group. It fell into last place after completing the Quick System Drive benchmark, but managed to outperform the InnoGrit-powered Patriot Viper VP4300 once tasked with the Full System Drive benchmark.
Get Tom's Hardware's best news and in-depth reviews, straight to your inbox.
Synthetic Testing - ATTO / CrystalDiskMark
ATTO and CrystalDiskMark (CDM) are free and easy-to-use storage benchmarking tools that SSD vendors commonly use to assign performance specifications to their products. Both of these tools give us insight into how each device handles different file sizes.

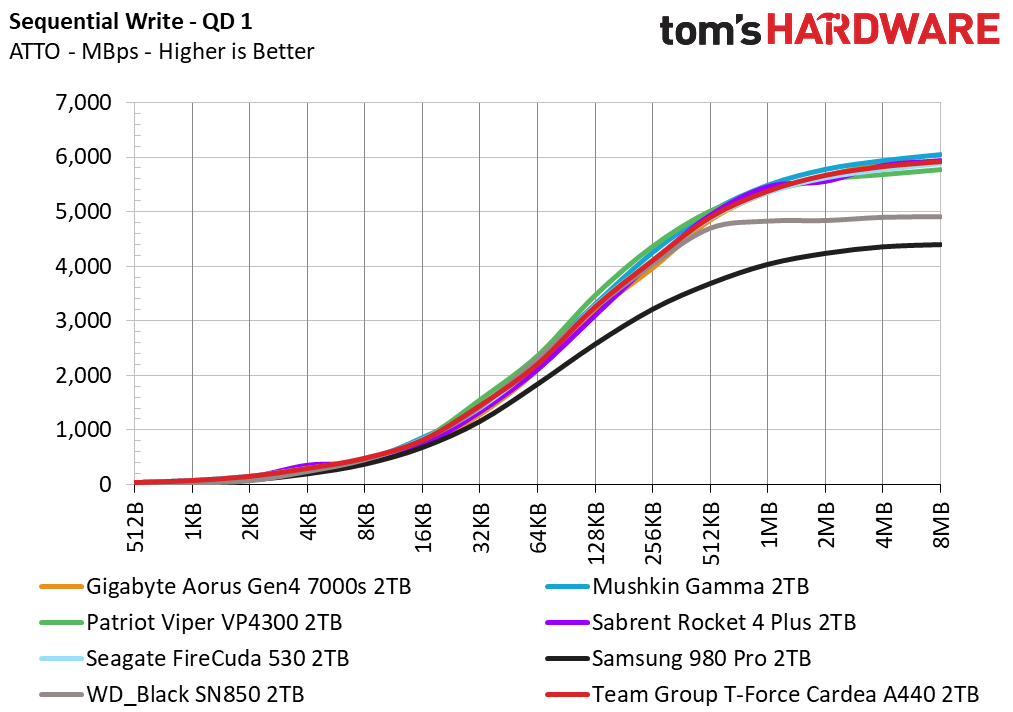
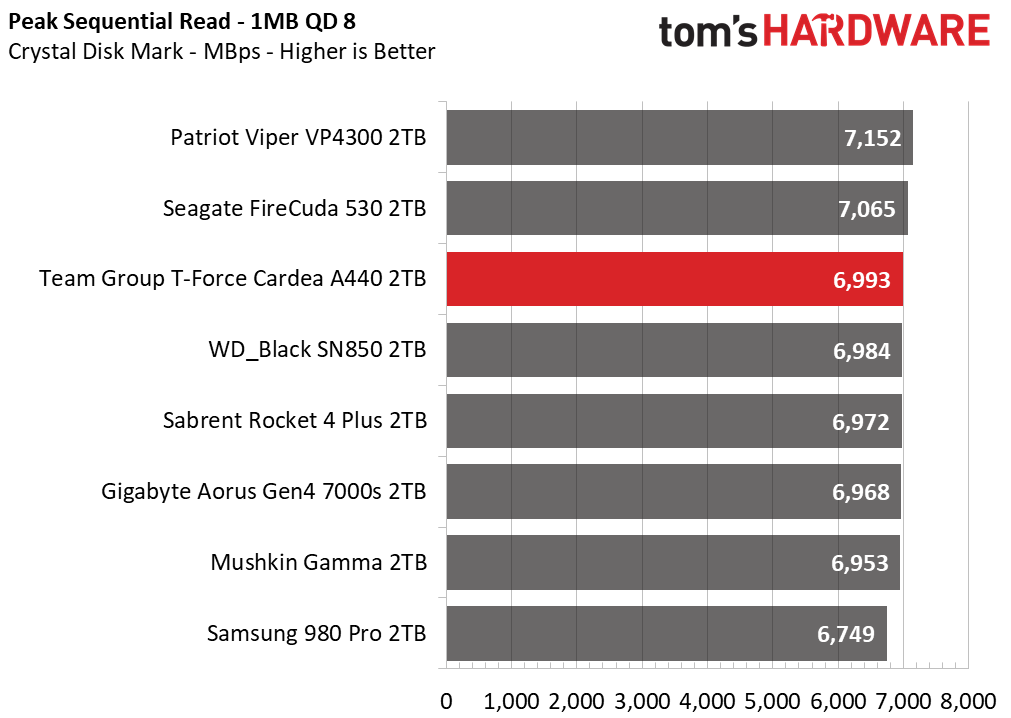
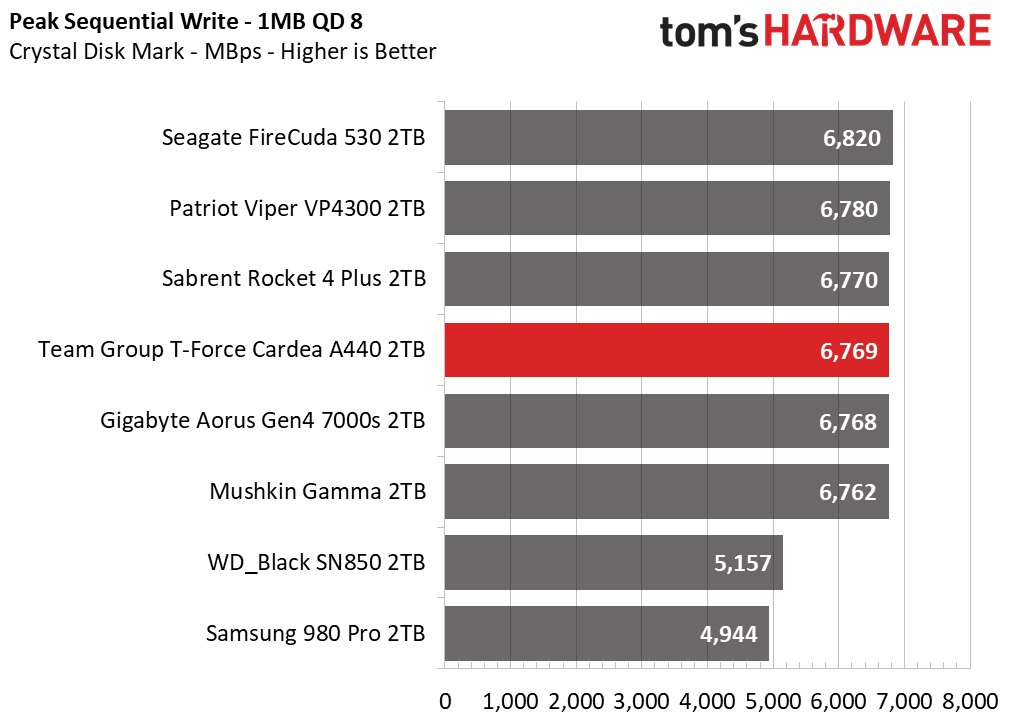
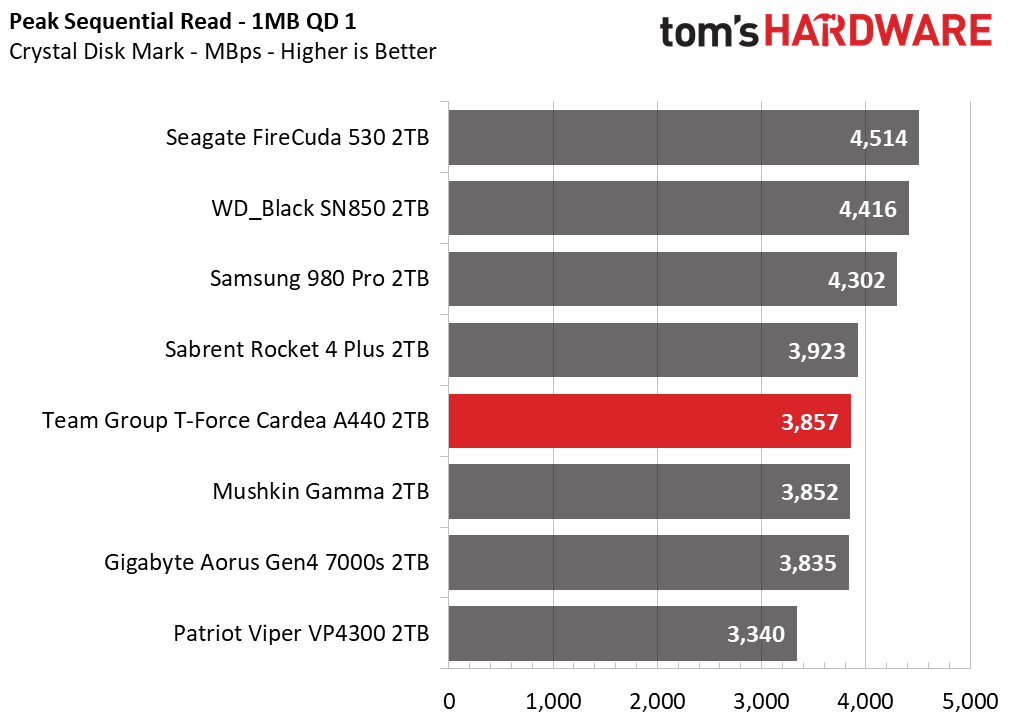
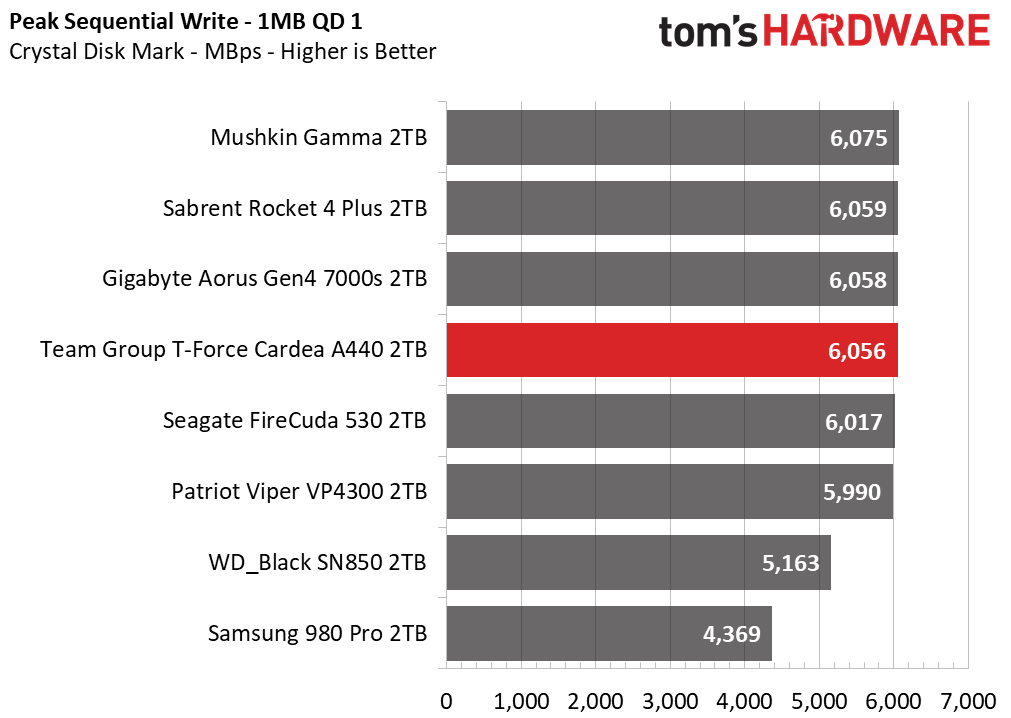
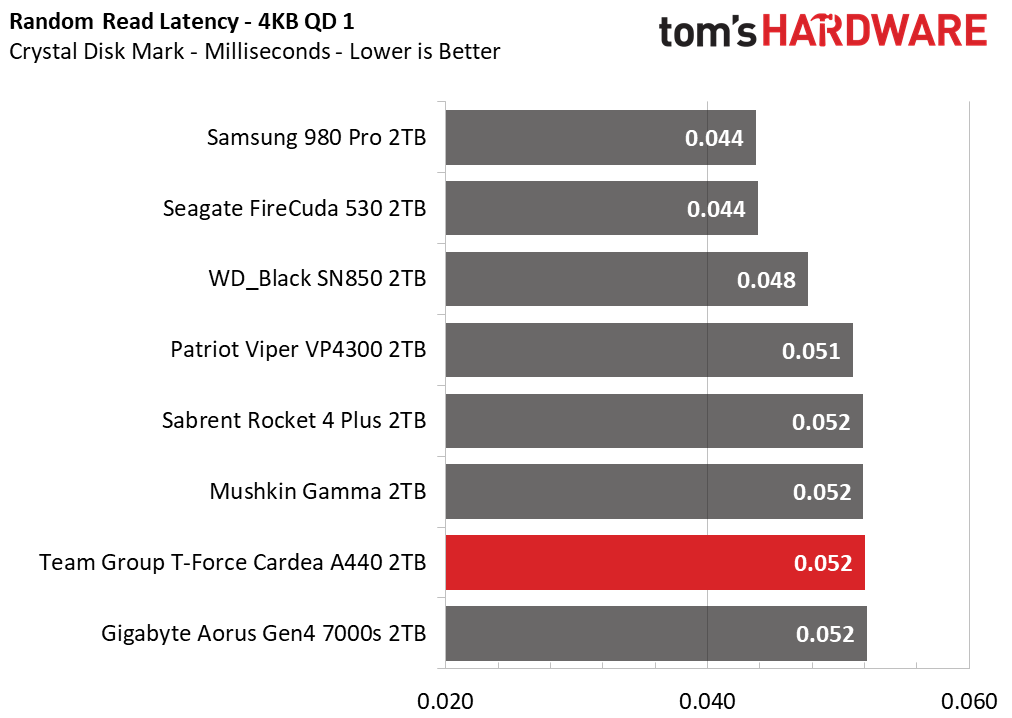
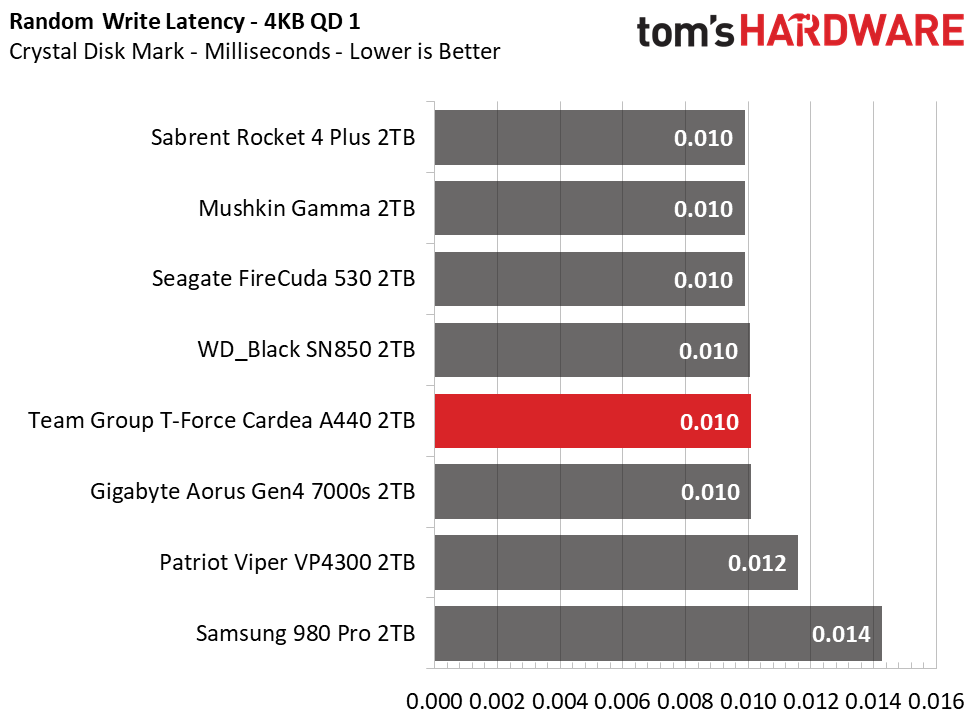
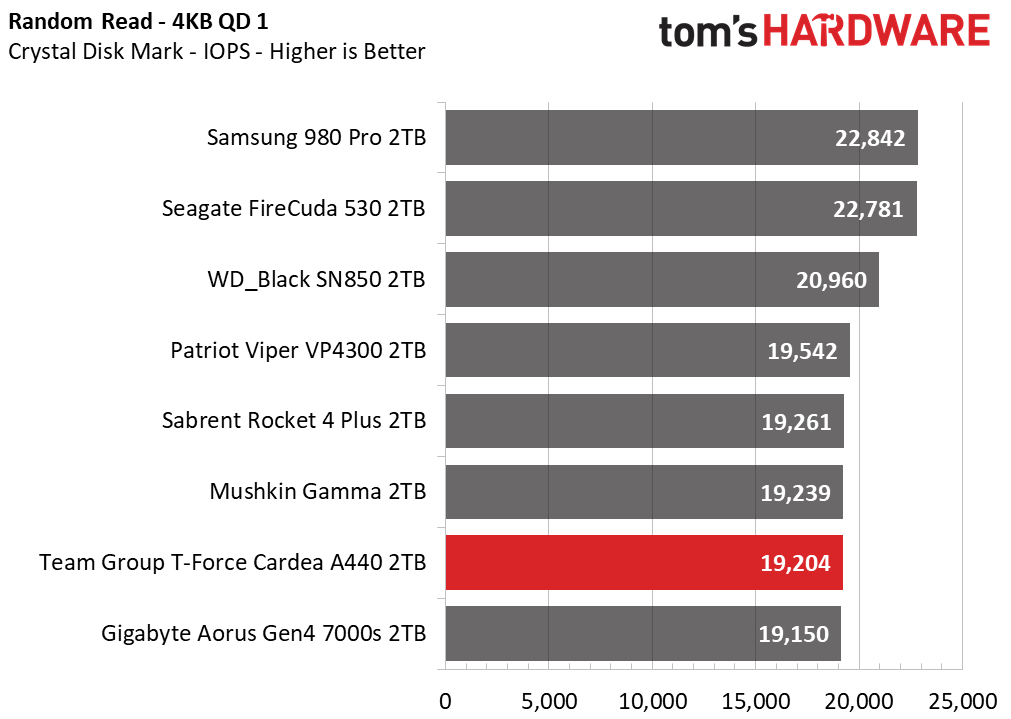
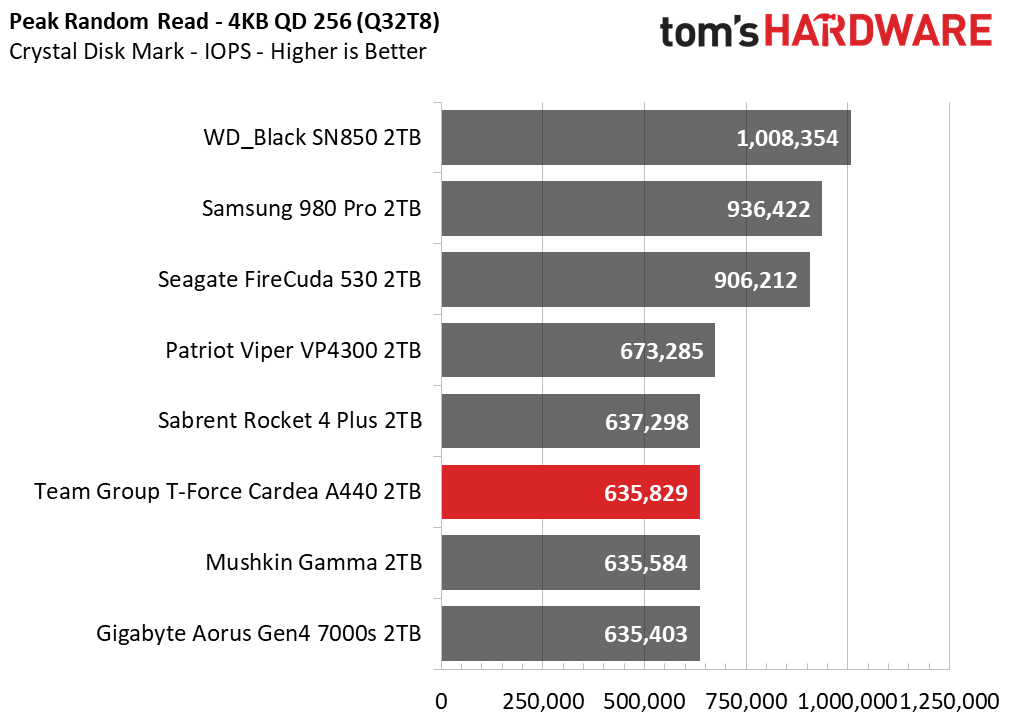
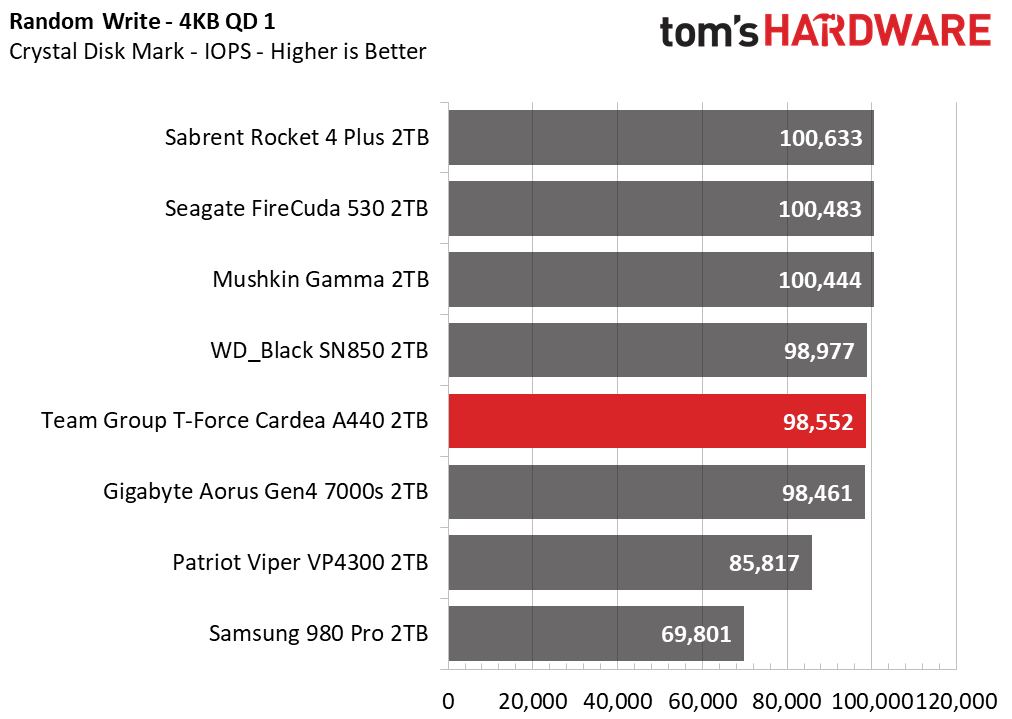
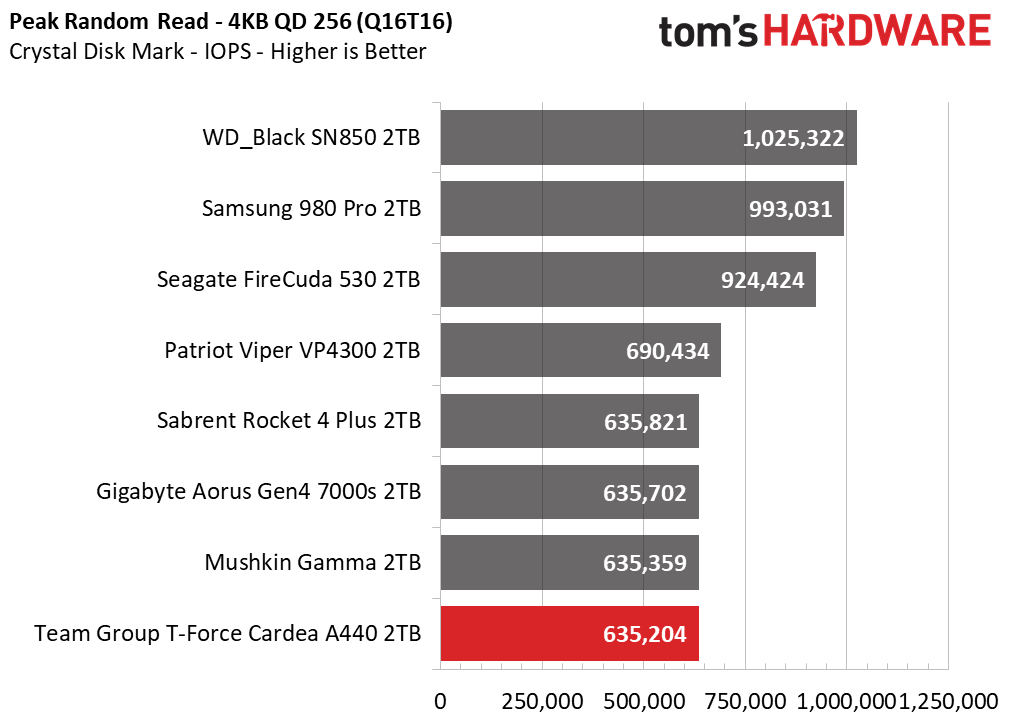
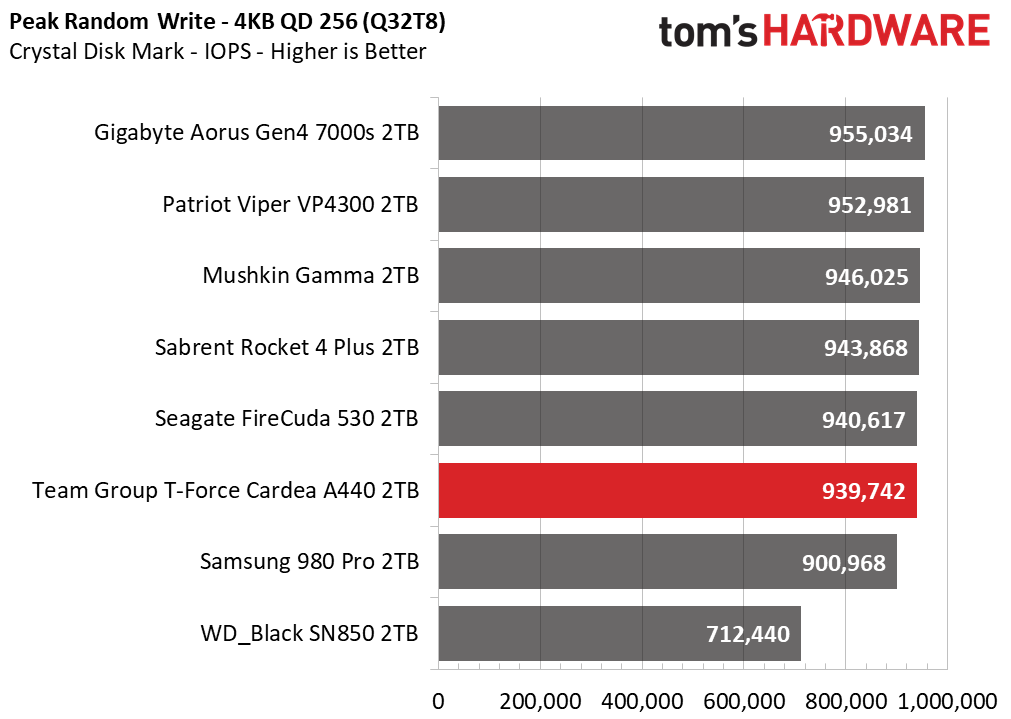
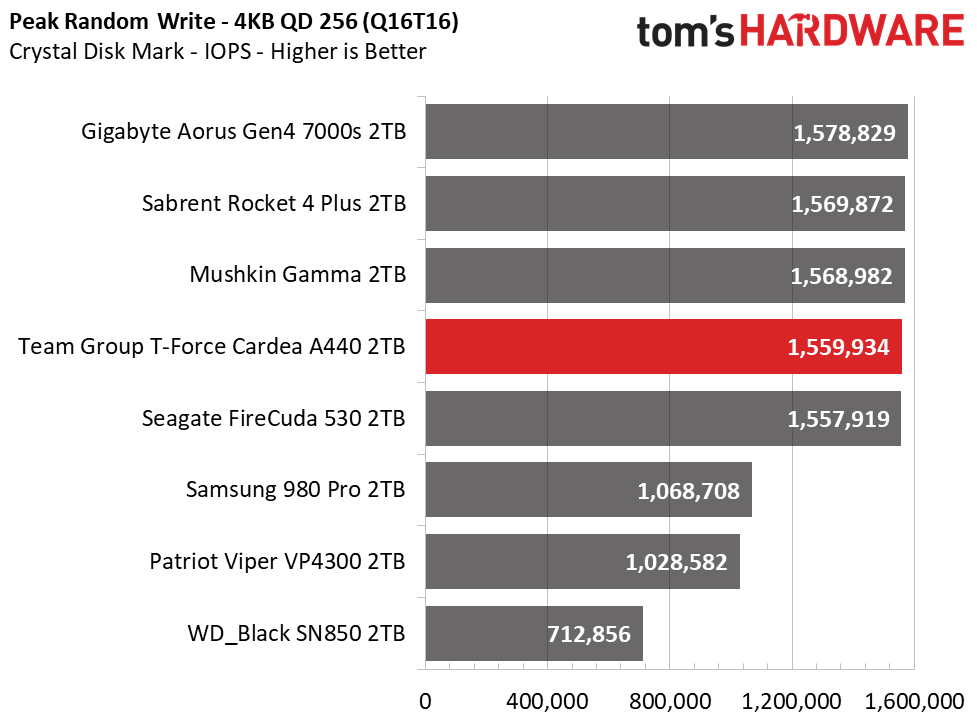
Sequential performance scales well at most block sizes, with no dips like the ones seen from the non-Phison E18-based competitors. The T-Force Cardea A440 delivers fast random performance, but isn’t quite as responsive at a QD of 1 as the Seagate FireCuda 530 with its newer 176L TLC, nor the Samsung or WD drives.
Sustained Write Performance and Cache Recovery
Official write specifications are only part of the performance picture. Most SSDs implement a write cache, which is a fast area of (usually) pseudo-SLC programmed flash that absorbs incoming data. Sustained write speeds can suffer tremendously once the workload spills outside of the cache and into the "native" TLC or QLC flash. We use iometer to hammer the SSD with sequential writes for 15 minutes to measure both the size of the write cache and performance after the cache is saturated. We also monitor cache recovery via multiple idle rounds.
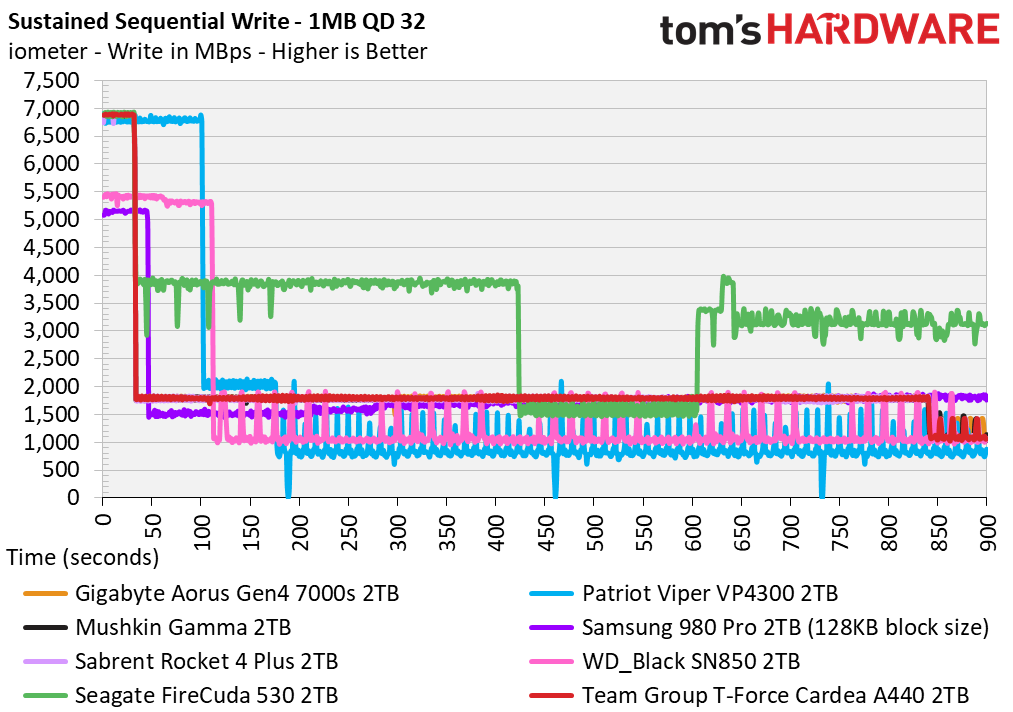
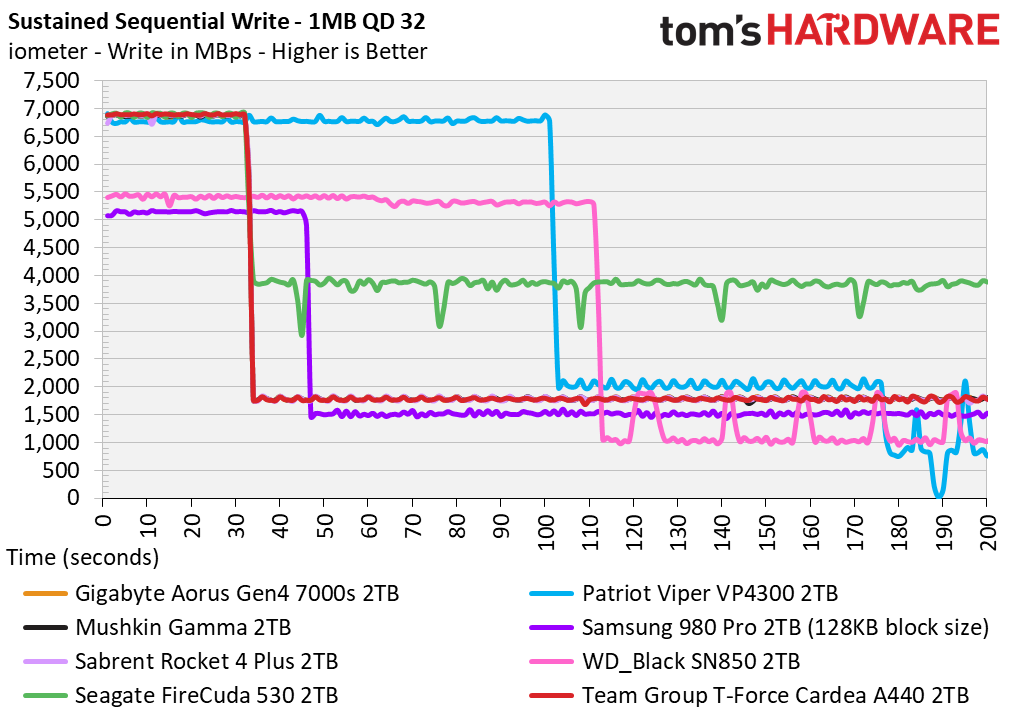
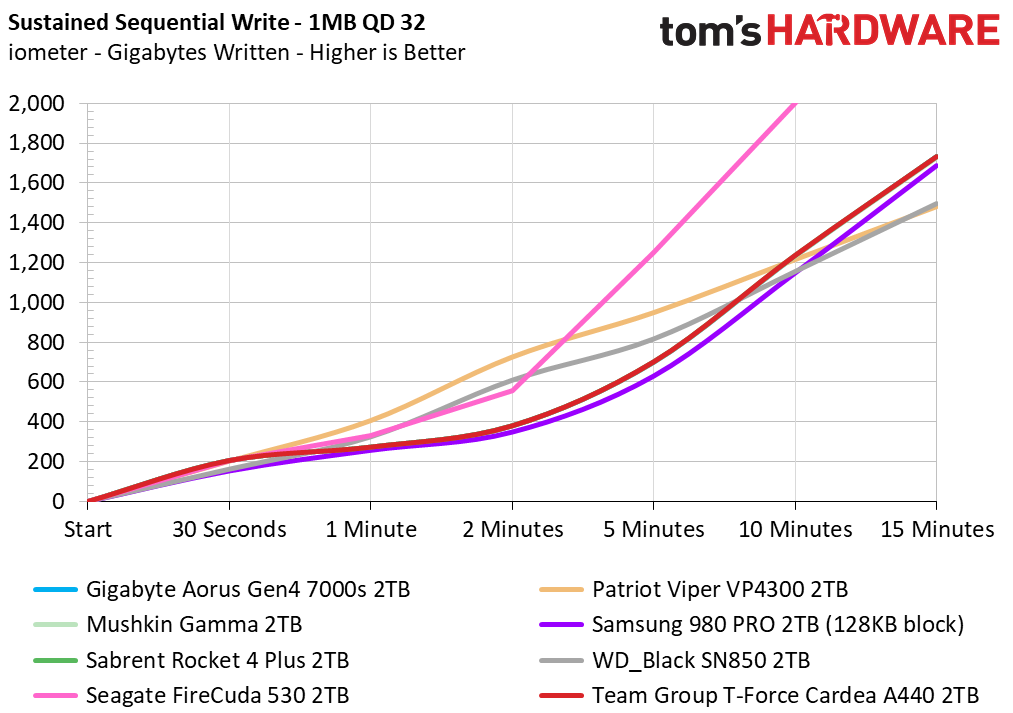
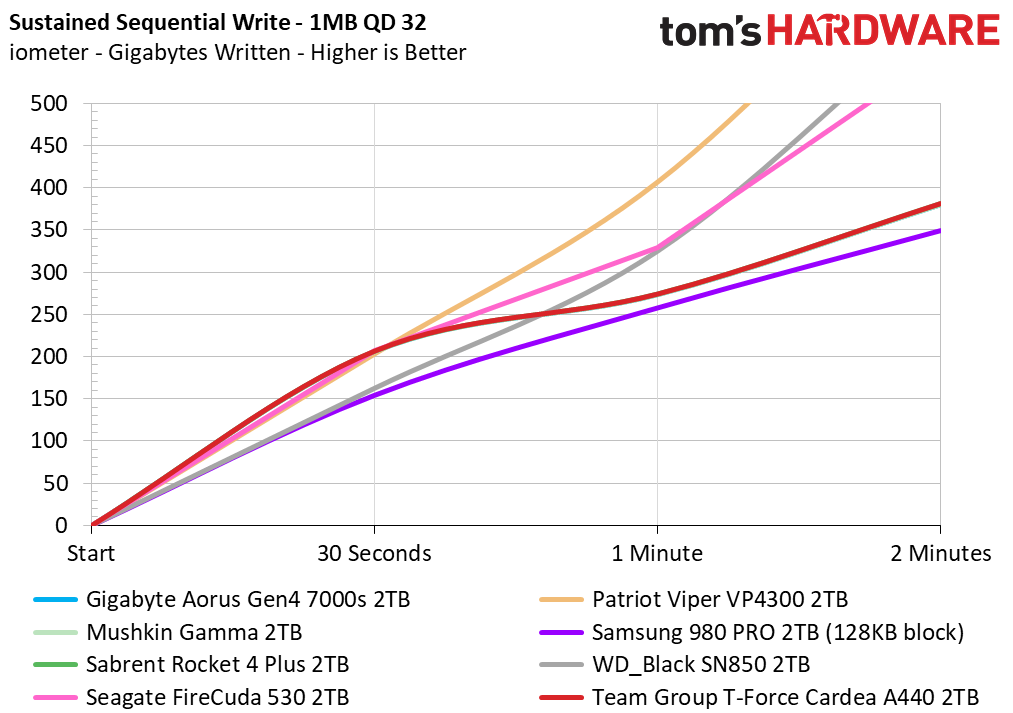
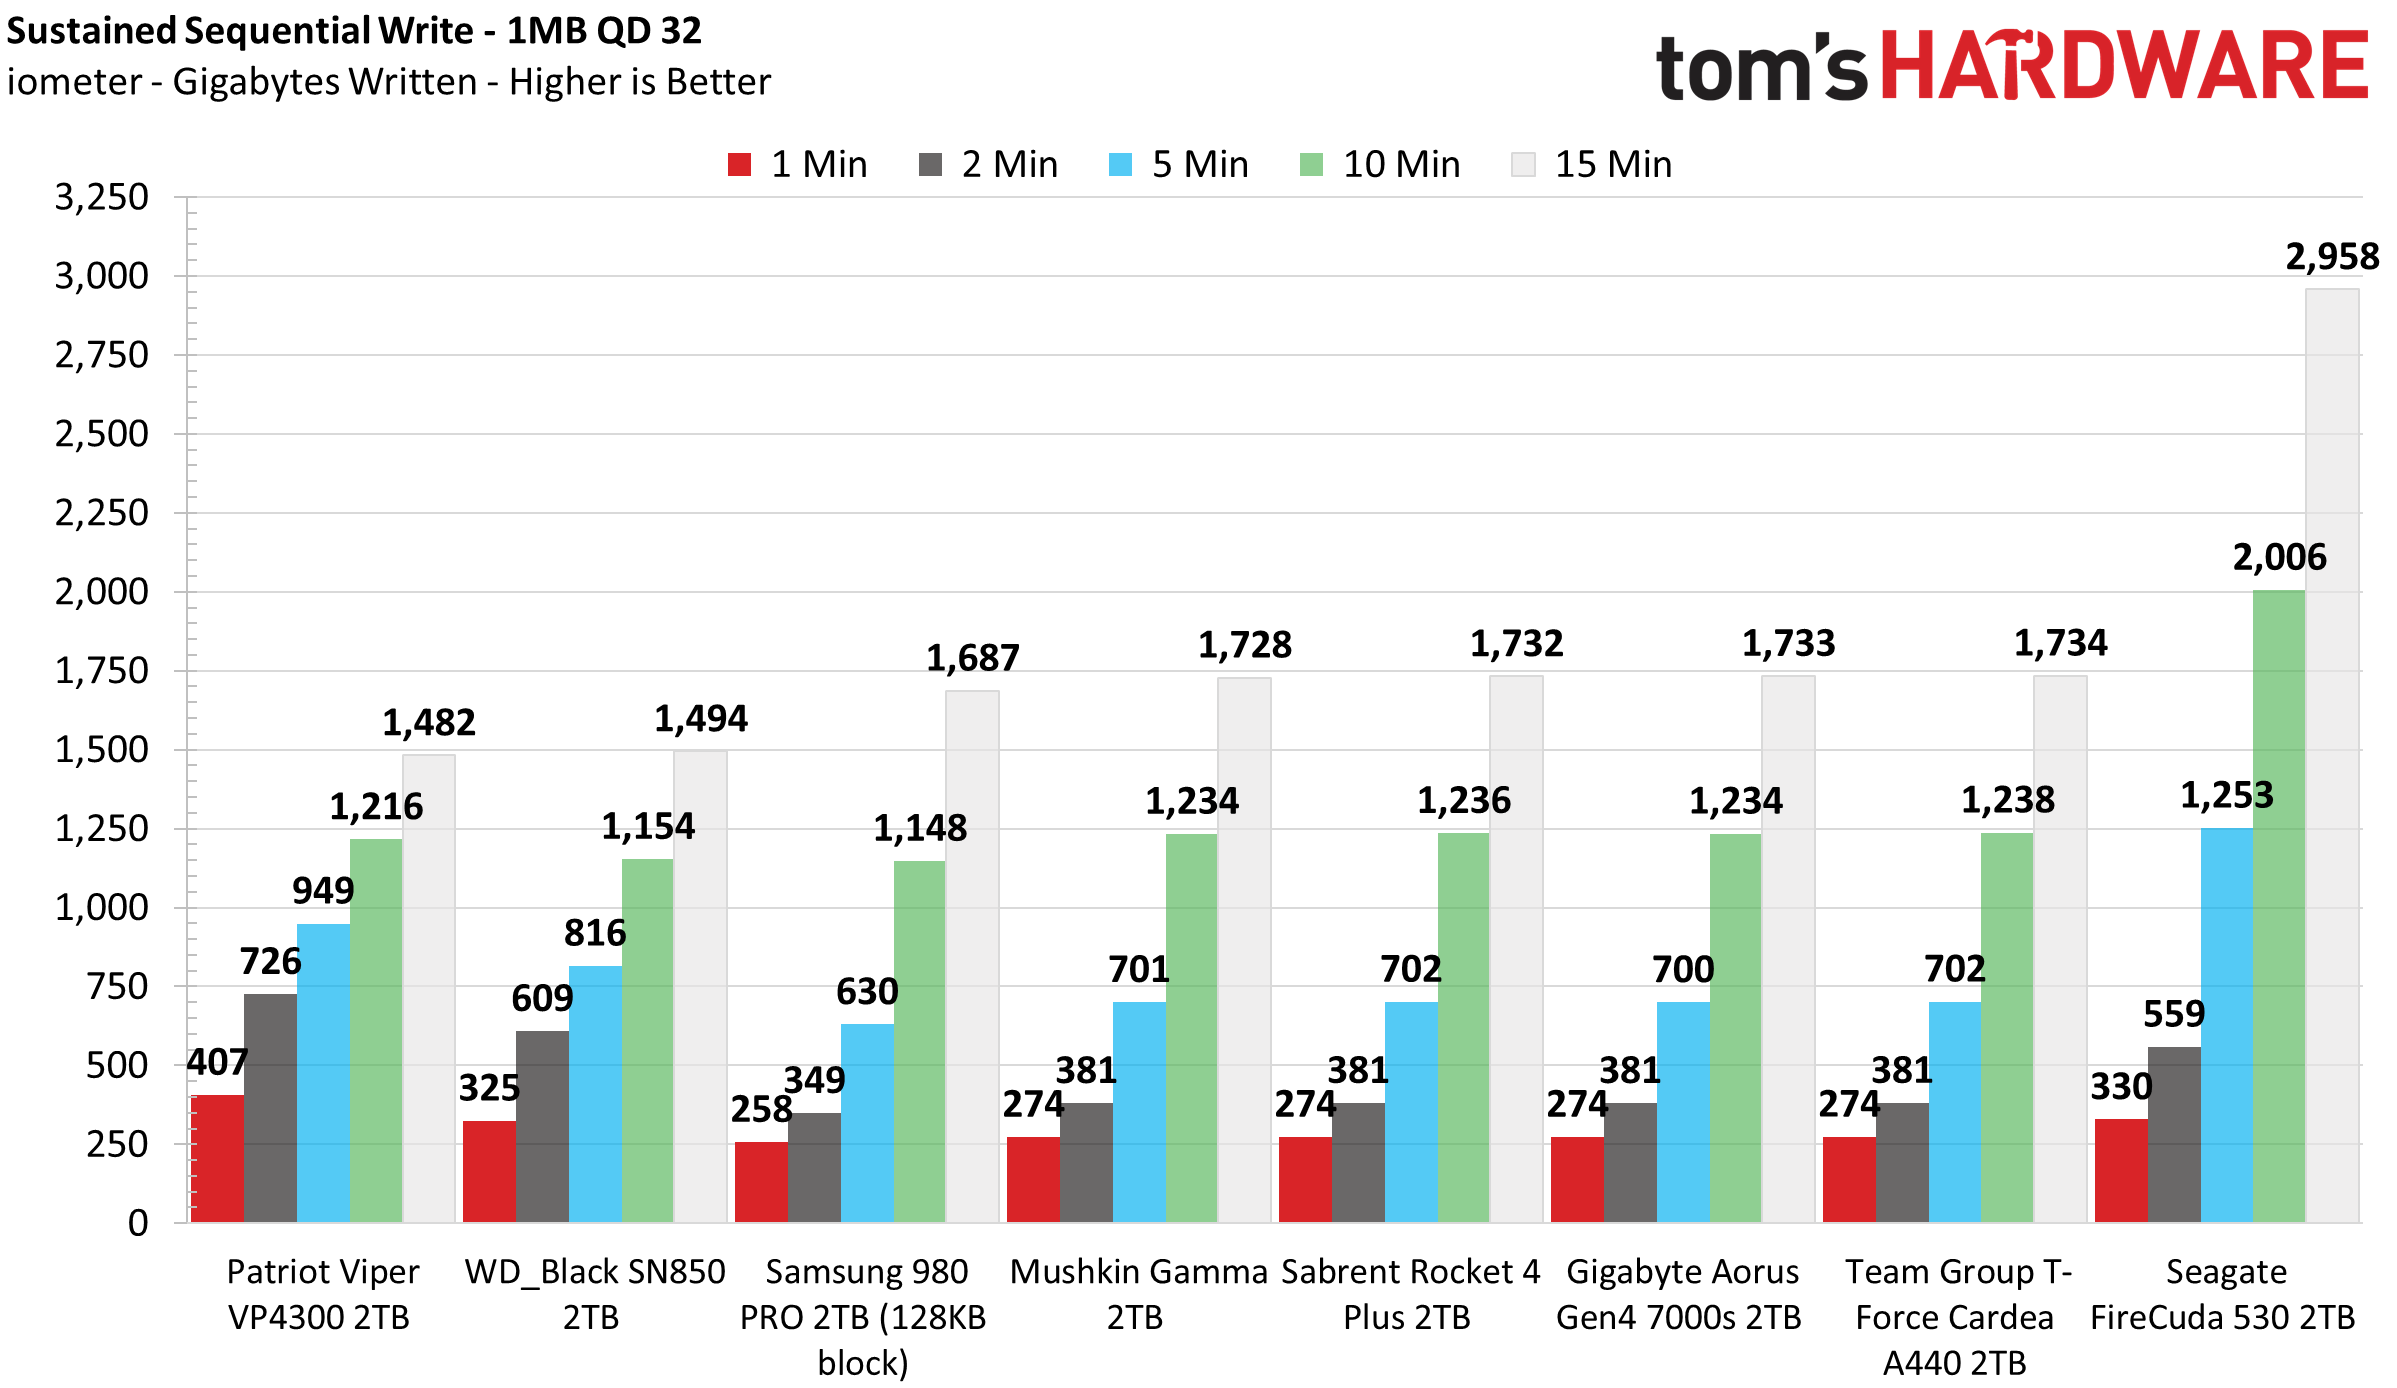
Team Group’s T-Force Cardea A440 leverages a large dynamic SLC cache. Our 2TB sample managed to absorb 225GB of data before degrading in performance from 6,850 MBps to 1,785 MBps. After writing an additional 1.44TB of data, the A440 degraded once more to an average write speed of 1,140 MBps until full. It’s SLC cache recovery was speedy though. Within only 1 minute of idle, the A440 recouped 172GB of its SLC cache.
Power Consumption and Temperature
We use the Quarch HD Programmable Power Module to gain a deeper understanding of power characteristics. Idle power consumption is an important aspect to consider, especially if you're looking for a laptop upgrade. Some SSDs can consume watts of power at idle while better-suited ones sip just milliwatts. Average workload power consumption and max consumption are two other aspects of power consumption, but performance-per-watt is more important. A drive might consume more power during any given workload, but accomplishing a task faster allows the drive to drop into an idle state more quickly, ultimately saving energy.
We also monitor the drive’s temperature via the S.M.A.R.T. data and an IR thermometer to see when (or if) thermal throttling kicks in and how it impacts performance. Bear in mind that results will vary based on the workload and ambient air temperature.
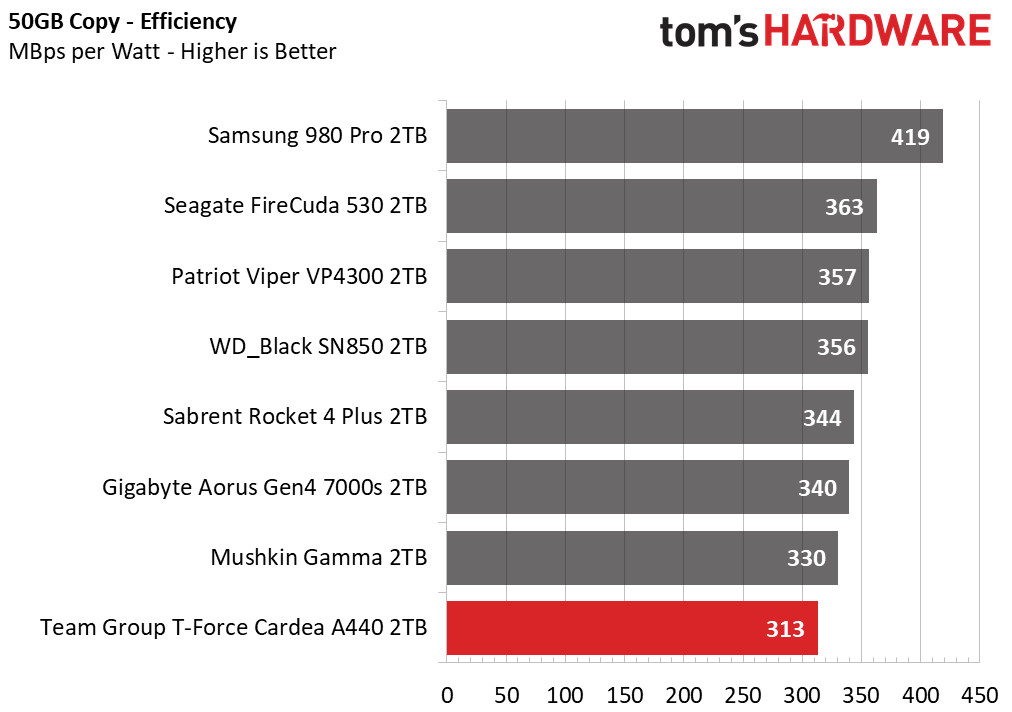
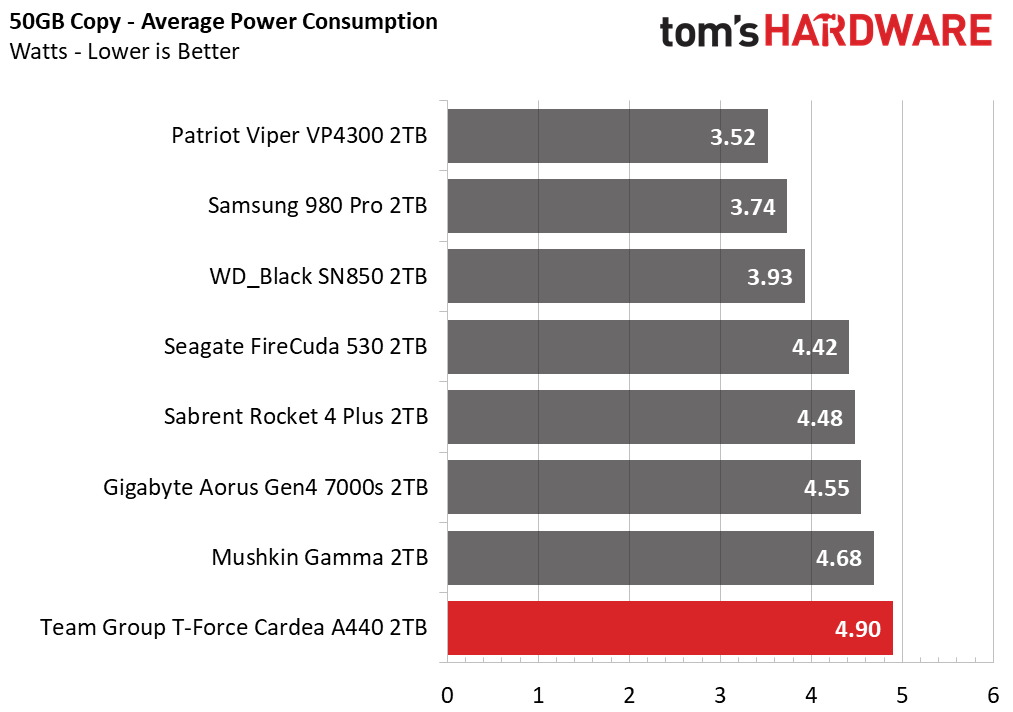
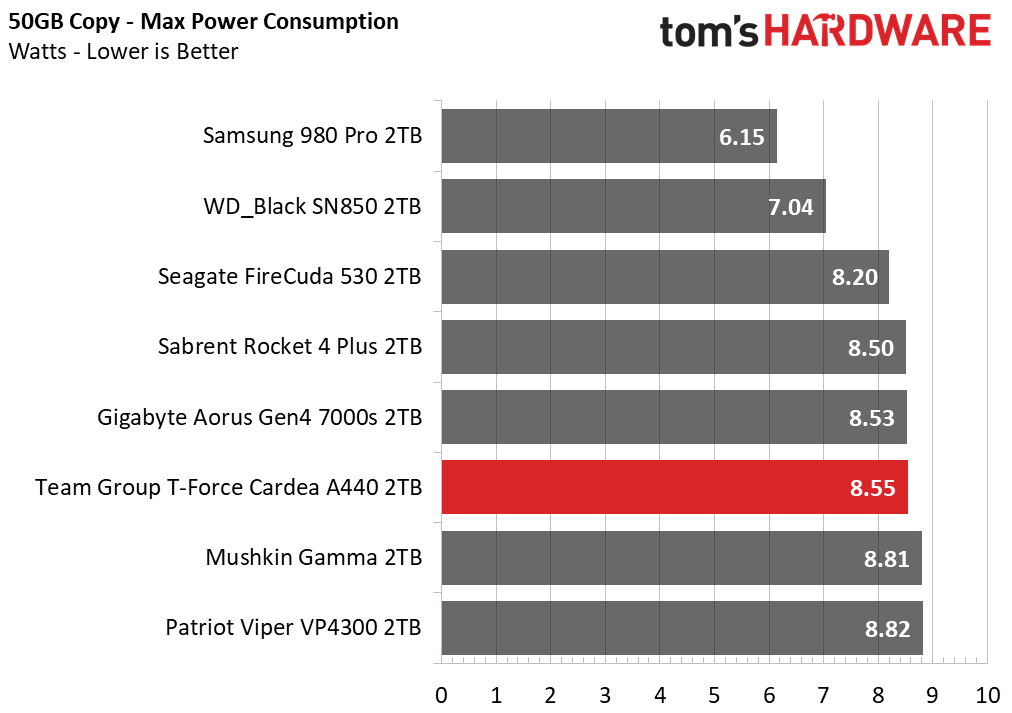
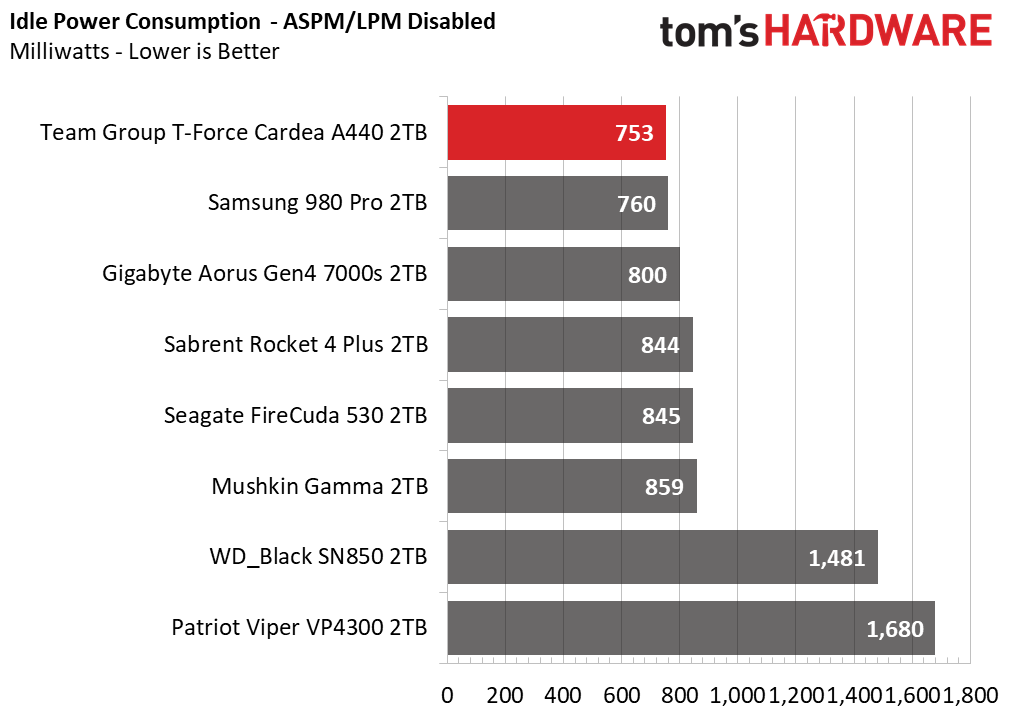
In terms of efficiency under load, the A440 lagged the competition, scoring last place on our chart. It consumed the most power out of all the other Phison E18 SSDs under load, but used the least amount of power at idle, roughly half that of the WD Black SN850 and Patriot Viper VP4300.
Without installing either of the included heatsinks, the A440 displayed thermal throttling after writing roughly 260GB of data in a 24 degree Celsius environment. With the graphene label installed, the thermal throttle was delayed quite a bit, occurring after writing 470GB of data. Controller temperatures peaked around 70-80 degrees Celsius as reported by its S.M.A.R.T. data, depending on if you use the graphene label or not. With the aluminum heatsink installed, the drive can still throttle if your transfers exceed 900GB and your system runs fan-less but other than that, it should keep cool under even fairly heavy use.
Test Bench and Testing Notes
| CPU | Intel Core i9-11900K |
| Motherboard | ASRock Z590 Taichi |
| Memory | 2x8GB Kingston HyperX Predator DDR4 5333 |
| Graphics | Intel UHD Graphics 750 |
| CPU Cooling | Alphacool Eissturm Hurricane Copper 45 3x140mm |
| Case | Streacom BC1 Open Benchtable |
| Power Supply | Corsair SF750 Platinum |
| OS Storage | WD_Black SN850 2TB |
| Operating System | Windows |
We use a Rocket Lake platform with most background applications such as indexing, windows updates, and anti-virus disabled in the OS to reduce run-to-run variability. Each SSD is prefilled to 50% capacity and tested as a secondary device. Unless noted, we use active cooling for all SSDs.
MORE: Best SSDs
MORE: How We Test HDDs And SSDs
MORE: All SSD Content

Sean is a Contributing Editor at Tom’s Hardware US, covering storage hardware.
