Display Testing Explained: How We Test PC Monitors
Our display benchmarks help you decide what monitor to put on your desktop.
Viewing Angles, Uniformity, Pixel Response and Input Lag
Viewing Angles
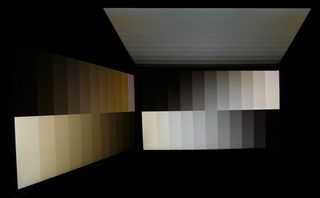
The more monitors we test, the more we can see that off-axis viewing performance is dependent not only on pixel structure (IPS, PLS, TN and so on), but backlight technology as well. The anti-glare layer makes a difference too.

In this test, a picture is worth 1,000 words. We set a Panasonic Lumix camera to manual exposure and zero its white balance to each individual monitor. We don't change any settings between shots. The top and side photos are taken at a 45-degree angle off-axis. Then, the three images are assembled into a composite. It’s a good approximation of what the eye actually sees when viewing a monitor off-center.
- Patterns used: Gray Steps (horizontal and vertical)
- Panasonic Lumix DMC-LX7, manual exposure
- Off-axis angle: 45 degrees horizontal and vertical
Screen Uniformity: Luminance
To measure screen uniformity, we use 0 and 100% full-field patterns and sample 9 points.
First, we establish a baseline measurement at the center of each screen. Next, we measure the surrounding eight points. Their values get expressed as a percentage of the baseline, either above or below. We average this number. It's important to note that other examples of the same monitor can measure differently, and we only test the review sample each vendor sends us.
Black field uniformity is also known as light bleed. If it’s visible, it shows up as light areas on an otherwise black screen. If the value is under 10%, we consider the monitor to have no visible problems in that regard.
In the white field test, our benchmark is the same 10%. Few displays score higher than that.
If a display has a uniformity compensation feature, we run the test with it off and on and compare the results.
- Patterns used: 100%White Field, 0% Black Field
- Where appropriate, we compare measurements with Uniformity Compensation on and off
- Results under 10% mean no aberrations are visible to the naked eye
Screen Uniformity: Color
To measure color uniformity, we display an 80% white field and measure the Delta E error of the same 9 points on the screen. Next, we subtract the lowest value from the highest to arrive at the result. A smaller number means a display is more uniform. Any value below 3 means the variation is invisible to the naked eye.
As in the white uniformity test, it’s rare that a display shows any color shift from zone to zone.
- Pattern used: 80% Gray Field
- Where appropriate, we compare measurements with Uniformity Compensation on and off
- Results with a Delta E of under 3 mean no color shift is visible to the naked eye
Pixel Response and Input Lag Tests
To perform these tests, we use a high-speed camera that shoots at 1,000 frames per second. Analyzing the video frame-by-frame allows us to observe the exact time it takes to go from a 0% signal to a 100% white field.
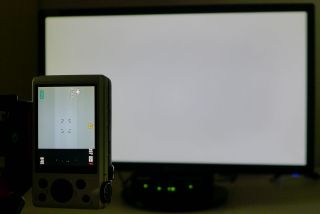
We place the pattern generator at the base of the monitor so our camera can capture the precise moment its front-panel LED lights up, indicating that it's receiving a video signal. With this camera placement, we can easily see how long it takes to fully display a pattern after pressing the button on the generator’s remote. This testing methodology allows for accurate and repeatable results when comparing panels.
Here’s a shot of our test setup. Click on the photo to enlarge.

The brighter section of the camera’s screen is what appears in the video. You can see the lights of the pattern generator in the bottom of the viewfinder. We flash the pattern on and off 5 times and average the results.
When we test monitors with refresh rates greater than 60 Hz, we have to use a PC as the signal source. We use the same white field pattern and trigger its appearance with a mouse movement. To record that motion we use the high-speed camera to see precisely how long it takes the screen to fully render after the mouse is moved. We run this test five times and average the result.
The response chart only shows how long it takes for the panel to draw a full white field from a black screen. To calculate the total input lag, we first time the period between initiating the signal to the beginning of the refresh cycle. Then, we add the screen draw time to arrive at the final result.
- Pattern used: 100% White Field
- Camera: Casio Exilim EX-ZR100 set to 1,000 fps (1 frame = 1 millisecond)
- Video analyzed frame-by-frame to calculate result
Response and Input Lag Tests for High Refresh Displays
Since our Accupel pattern generator maxes out at 60 Hz, we had to find another way to test monitors with refresh rates faster than that.
We still use our Casio camera that shoots video at 1,000 frames per second. But instead of flashing white field patterns from the generator, we use a white screen in Windows and the blank setting of the screen saver. The camera is set up to capture the screen and a mouse in the same frame. We set the screen to blank, then bump the mouse with a finger to pop up the white field. Analyzing the video shows precisely when our finger contacts the mouse. Then, we count the frames until the screen is fully drawn. This tells us how long it takes one frame to fully appear and the delay between contact with the mouse and the reaction of the monitor. Since the video is 1,000 frames per second, we know that each frame is 1ms.
Current page: Viewing Angles, Uniformity, Pixel Response and Input Lag
Prev Page Grayscale Tracking, Gamma Response and Color Gamut Next Page HDR Testing and Final ThoughtsStay on the Cutting Edge
Join the experts who read Tom's Hardware for the inside track on enthusiast PC tech news — and have for over 25 years. We'll send breaking news and in-depth reviews of CPUs, GPUs, AI, maker hardware and more straight to your inbox.

Christian Eberle is a Contributing Editor for Tom's Hardware US. He's a veteran reviewer of A/V equipment, specializing in monitors. Christian began his obsession with tech when he built his first PC in 1991, a 286 running DOS 3.0 at a blazing 12MHz. In 2006, he undertook training from the Imaging Science Foundation in video calibration and testing and thus started a passion for precise imaging that persists to this day. He is also a professional musician with a degree from the New England Conservatory as a classical bassoonist which he used to good effect as a performer with the West Point Army Band from 1987 to 2013. He enjoys watching movies and listening to high-end audio in his custom-built home theater and can be seen riding trails near his home on a race-ready ICE VTX recumbent trike. Christian enjoys the endless summer in Florida where he lives with his wife and Chihuahua and plays with orchestras around the state.
-
dputtick Hi! For the input lag tests for monitors with refresh rates greater than 60hz, do you test multiple times and take the average (to rule out variability coming from the USB driver, buffering in the GPU, etc)? Have you investigated how much latency all of that adds? Would be nice to have an apples-to-apples comparison with the tests done via the pattern generator. Also curious if you've looked into getting a pattern generator that pushes more than 60hz, or if such a thing exists. Thanks so much for doing all of these tests!Reply
