Nvidia details new software that enables location tracking for AI GPUs — opt-in remote data center GPU fleet management includes power usage and thermal monitoring
Including tracking of physical location.

Get Tom's Hardware's best news and in-depth reviews, straight to your inbox.
You are now subscribed
Your newsletter sign-up was successful
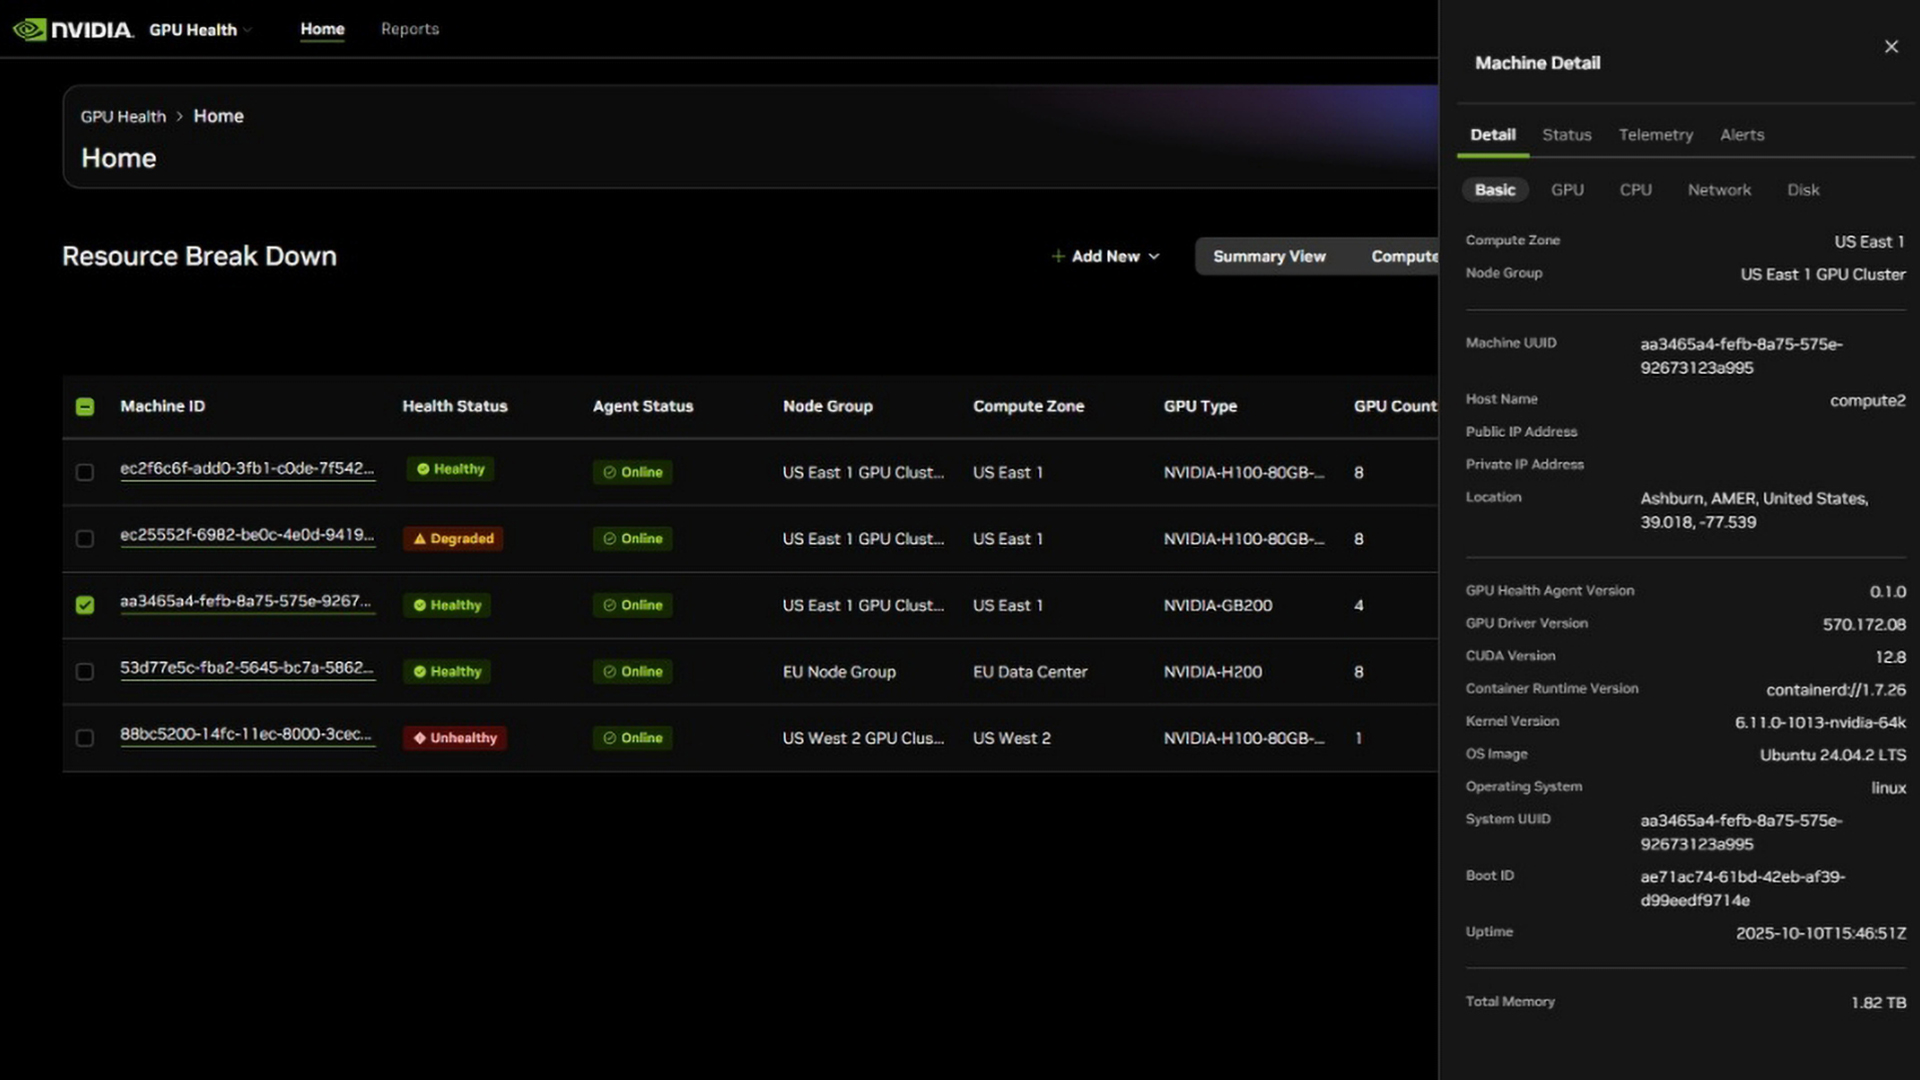
Following reports that Nvidia has developed a data fleet management software that can track physical locations of its GPUs, Nvidia on Thursday detailed its GPU fleet monitoring software. The software indeed enables data center operators to monitor various aspects of an AI GPU fleet. Among other things, it allows for detecting the physical location of these processors, a possible deterrent against smuggling chips. However, there is a catch: the software is opt-in rather than mandatory, which may limit its effectiveness as a tool to thwart smugglers, whether nation-state or otherwise.
The software collects extensive telemetry, which is then aggregated into a central dashboard hosted on Nvidia's NGC platform. This interface lets customers visualize GPU status across their entire fleet, either globally or by compute zones representing specific physical or cloud locations, which means the software can detect the physical location of Nvidia hardware. Operators can view fleet-wide summaries, drill into individual clusters, and generate structured reports containing inventory data and system-wide health information.
Nvidia stresses that the software is strictly observational: it provides insight into GPU behavior but cannot act as a backdoor or a kill switch. As a result, even if Nvidia discovers via the NGC platform that some of its GPUs have been smuggled to China, it cannot switch them off. However, the company could probably use the data to figure out how the GPUs arrived at that location. Nvidia says the software is a customer-installed, open-source client agent that is transparent and auditable.
Article continues belowNvidia's new fleet-management software gives data center operators a detailed, real-time view of how their GPU infrastructure behaves under load. It continuously collects telemetry on power behavior — including short-duration spikes — enabling operators to stay within power limits. In addition to power data, the system monitors utilization, memory bandwidth usage, and interconnection health across fleets, to enable operators to maximize utilization and performance per watt. These indicators help expose load imbalance, bandwidth saturation, and link-level issues that can quietly degrade performance across large AI clusters.
Another focus of the software is thermals and airflow conditions to avoid thermal throttling and premature component aging. By catching hotspots and insufficient airflow early, operators can avoid performance drops that typically accompany high-density compute environments and, in many cases, prevent premature aging of AI accelerators.
The system also verifies whether nodes share consistent software stacks and operational parameters, which is crucial for reproducible datasets and predictable training behavior. Any configuration divergence, such as mismatched drivers or settings, becomes visible in the platform.
It is important to note that Nvidia's new fleet-management service is not the company's only tool for remotely diagnosing and controlling GPU behavior, though it is the most advanced. For example, DCGM is a local diagnostic and monitoring toolkit that exposes raw GPU health data, but requires operators to build their own dashboards and aggregation pipelines, which greatly shrinks its usability, but enables operators to build the tools they need themselves. There is also Base Command, a workflow and orchestration environment designed for AI development, job scheduling, dataset management, and collaboration, not for in-depth hardware monitoring.
Get Tom's Hardware's best news and in-depth reviews, straight to your inbox.
Meanwhile, all three tools represent a formidable set of knobs for data center operators. DCGM provides node-level probes, Base Command handles workloads, and the new service integrates them into a fleet-wide visibility platform that scales to geographically distributed GPU deployments.

Follow Tom's Hardware on Google News, or add us as a preferred source, to get our latest news, analysis, & reviews in your feeds.

Anton Shilov is a contributing writer at Tom’s Hardware. Over the past couple of decades, he has covered everything from CPUs and GPUs to supercomputers and from modern process technologies and latest fab tools to high-tech industry trends.
-
jp7189 Despite the click bait title. This actually looks like a very useful thing for managing large centers full of GPUs and understanding/planning/optimizing power and cooling loads.Reply -
Notton Question I have is.Reply
Is this a feature on the GPU die, or is it done through an additional chip on the board?
I assume it's the latter, but just want to be sure. -
bit_user Reply
Modern Nvidia GPUs feature a core called the GPU System Processor (GSP). This is a RISC-V core that acts as an orchestrator and has access to run various management operations. They also contain dozens more RISC-V cores that perform more specialized tasks, like clock and power management.Notton said:Question I have is.
Is this a feature on the GPU die, or is it done through an additional chip on the board?
I assume it's the latter, but just want to be sure.
So, I assume the telemetry is implemented by the GSP talking to many of those other cores, in order to carry out most of the necessary operations. They would avoid having a physically distinct chip, because it's more expensive and wastes valuable and scarce board space for something that only adds a tiny bit more area to their main GPU die.
If you're particularly interested in the subject, this is a really good video to watch, but keep in mind that the speaker uses the term "heart" to refer to what we know as a conventional CPU core (blame Nvidia and their confusing use of the term "core" in a GPU context).
C5A9z_Yk0KAView: https://www.youtube.com/watch?v=C5A9z_Yk0KA