Corsair RM750x PSU Review: Improving On A Classic
Why you can trust Tom's Hardware
Cross-Load Tests & Infrared Images
Our cross-load tests are described in detail here.
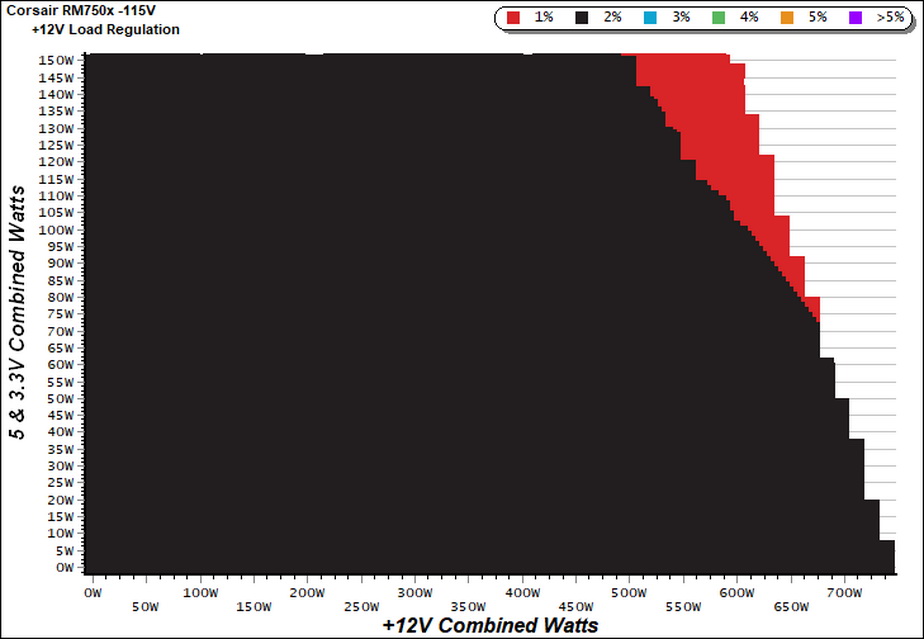
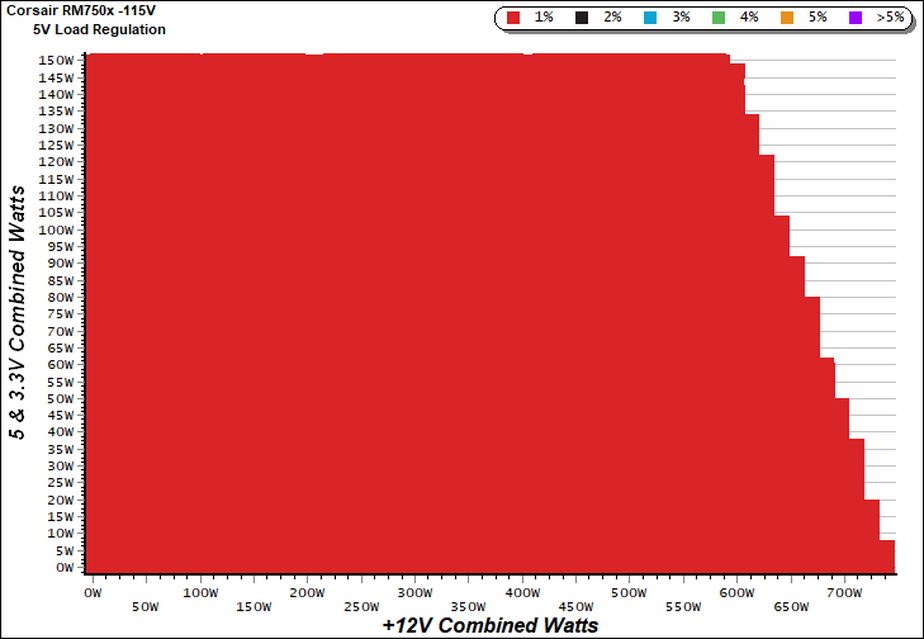
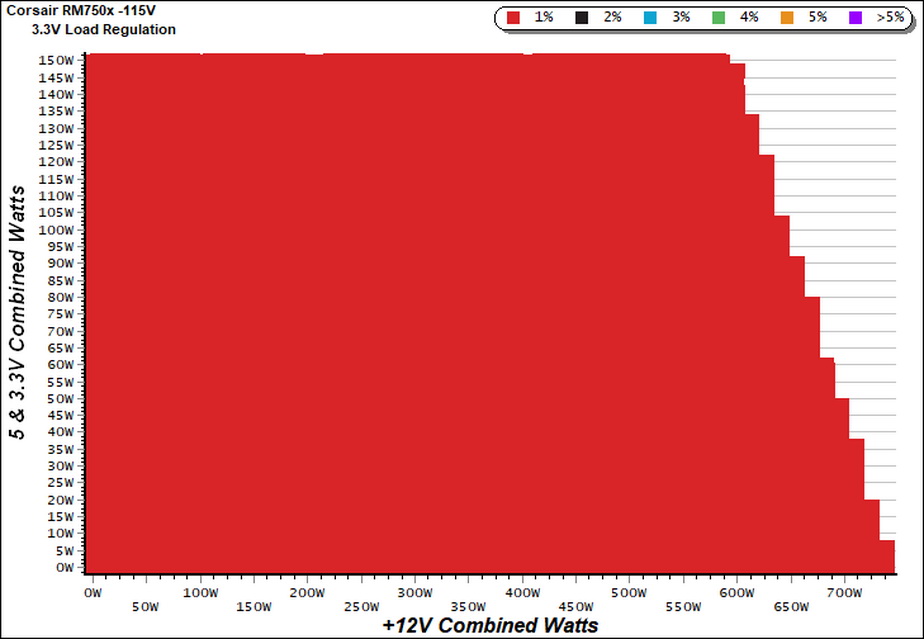
To generate the following charts, we set our loaders to auto mode through our custom-made software before trying more than 25,000 possible load combinations with the +12V, 5V, and 3.3V rails. The load regulation deviations in each of the charts below were calculated by taking the nominal values of the rails (12V, 5V, and 3.3V) as point zero. The ambient temperature was between at 30°C (86°F) to 32°C (89.6°F).
Load Regulation Charts
Efficiency Chart
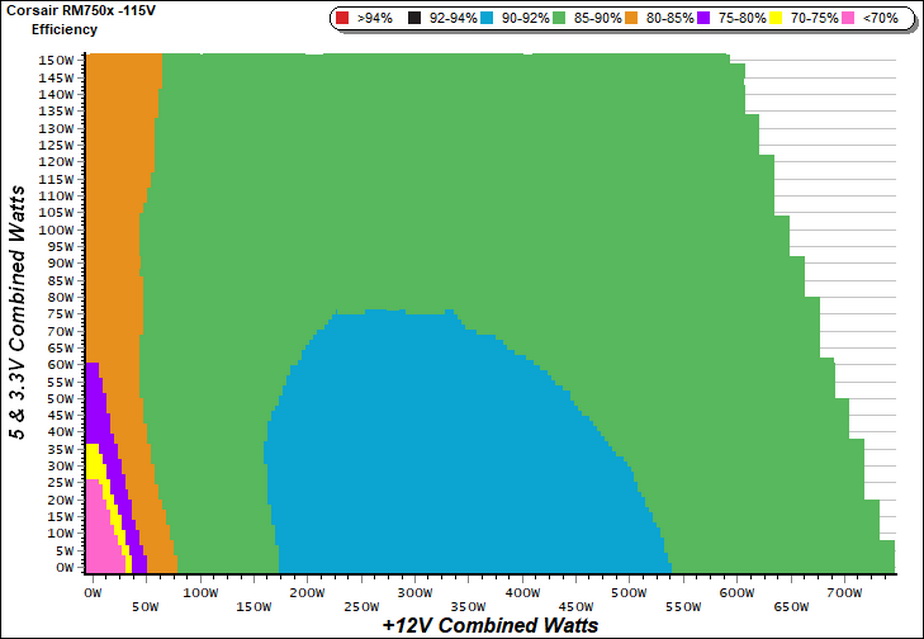
It would have been nice to see an area of the chart with greater-than 92% efficiency. Nonetheless, the 90-92% region is large enough.
Ripple Charts
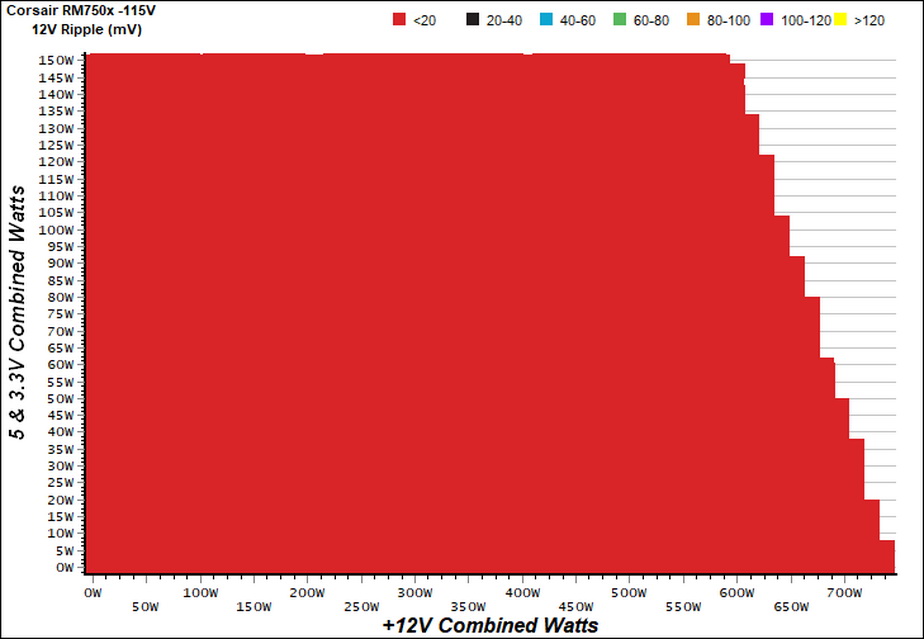
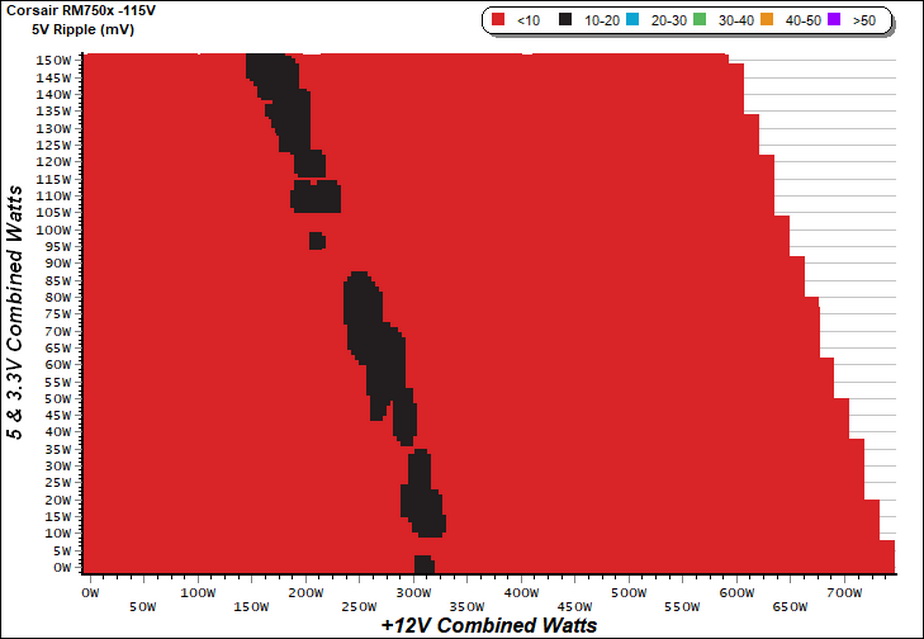
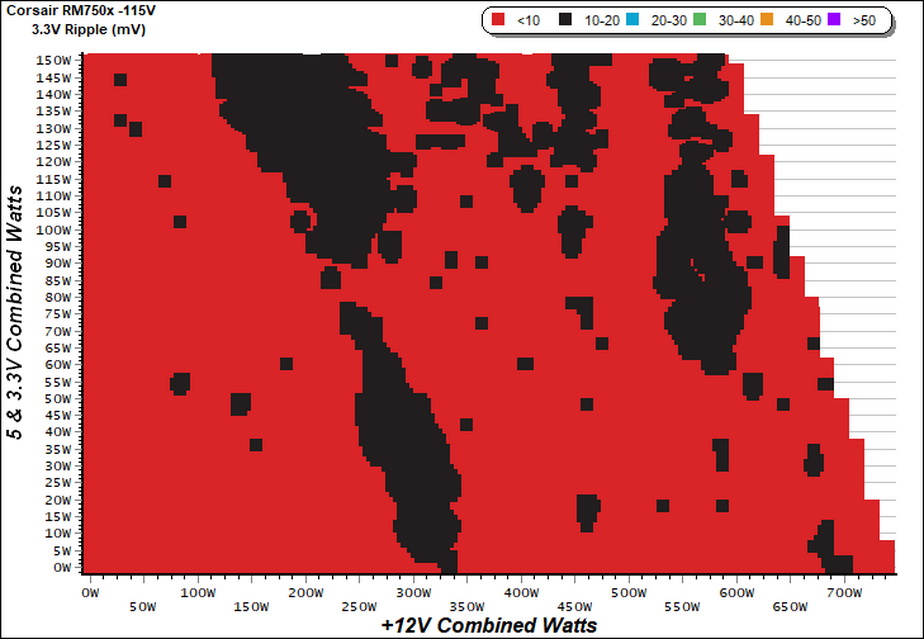
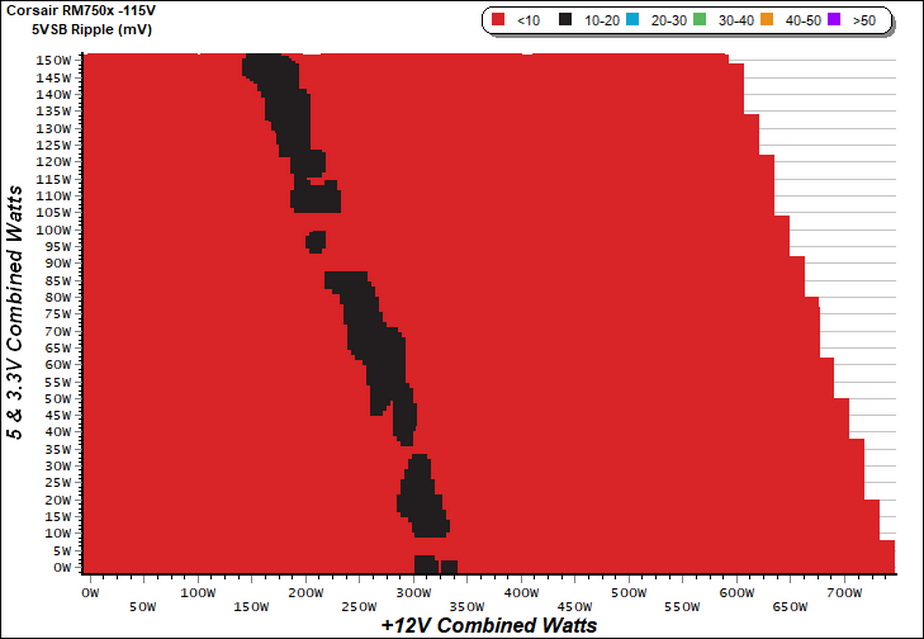
Infrared Images
We applied half-load for 10 minutes with the PSU's top cover and cooling fan removed before taking photos with our modified FLIR E4 camera that delivers 320x240 IR resolution (76,800 pixels).
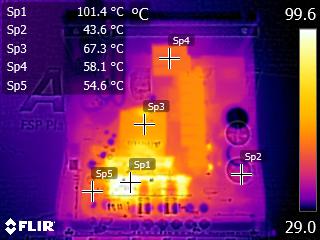
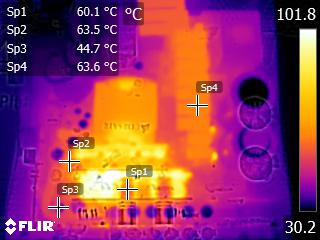
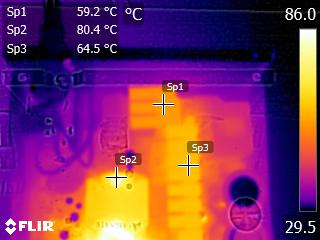
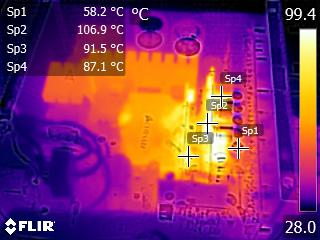
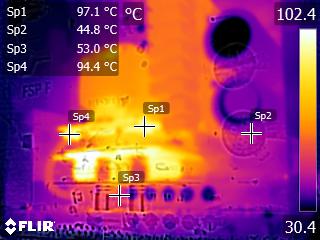
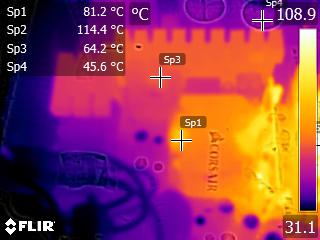
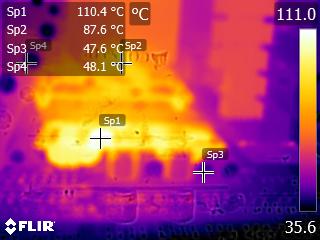
The DC-DC converters got quite hot when we applied 10A to each of the minor rails. That's why the PSU's fan started spinning once we pushed those converters.
MORE: Best Power Supplies
MORE: How We Test Power Supplies
Get Tom's Hardware's best news and in-depth reviews, straight to your inbox.
MORE: All Power Supply Content
Current page: Cross-Load Tests & Infrared Images
Prev Page Protection Features Next Page Transient Response Tests
Aris Mpitziopoulos is a contributing editor at Tom's Hardware, covering PSUs.
-
joedavies87 I bought one last year and did not realize that I would need two EPS cables for future builds. Moved to EVGA. Corsair was too late.Reply
