FSP Hydro PTM 650W PSU Review: Clean, Quiet Power for Mid-Range PCs
Why you can trust Tom's Hardware
Cross-Load Tests and Infrared Images
Our cross-load tests are described in detail here.
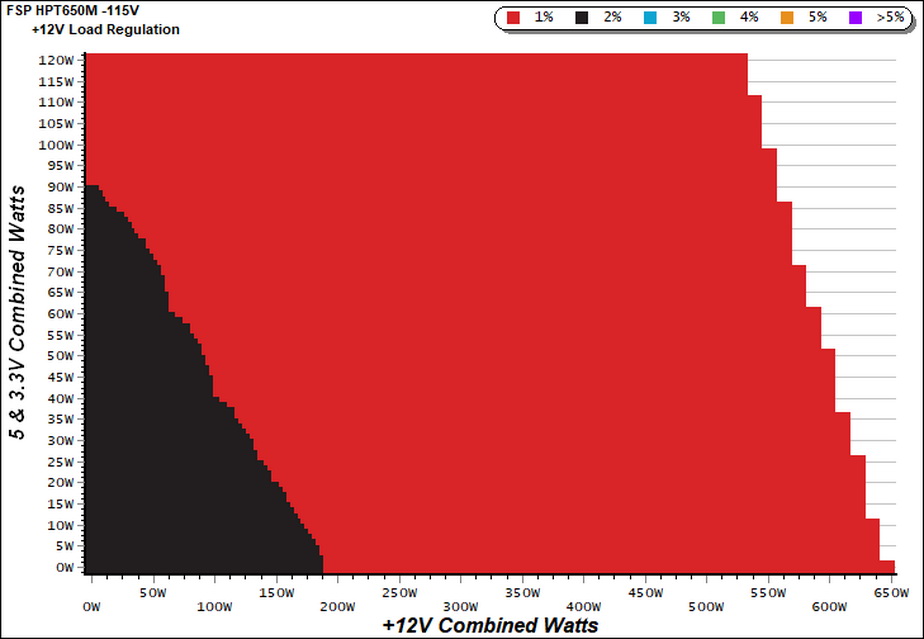
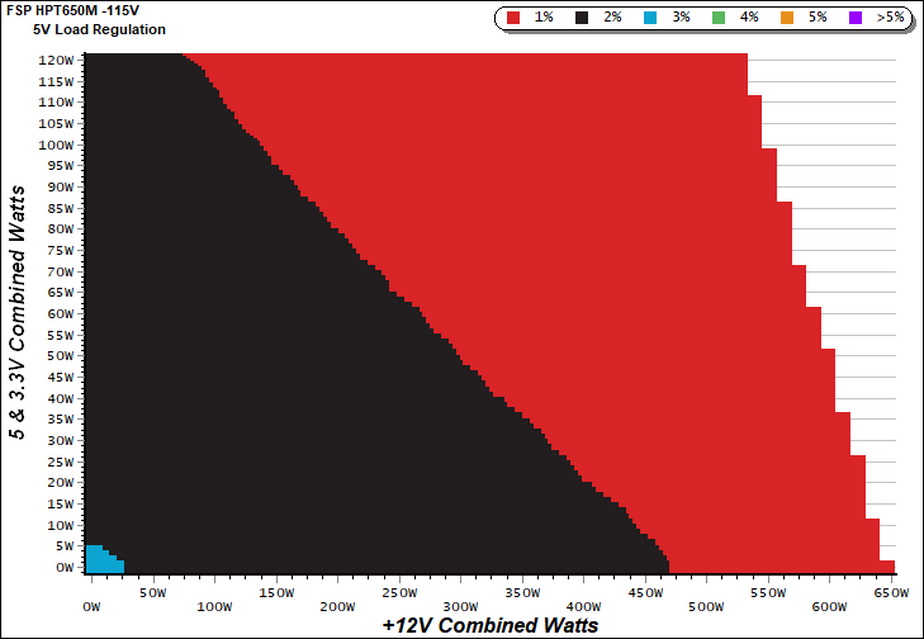
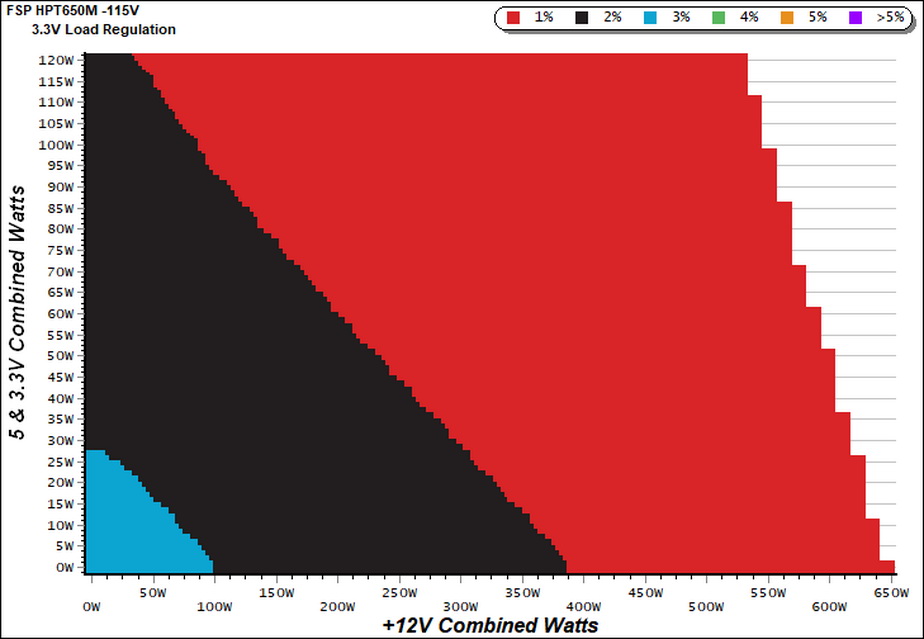
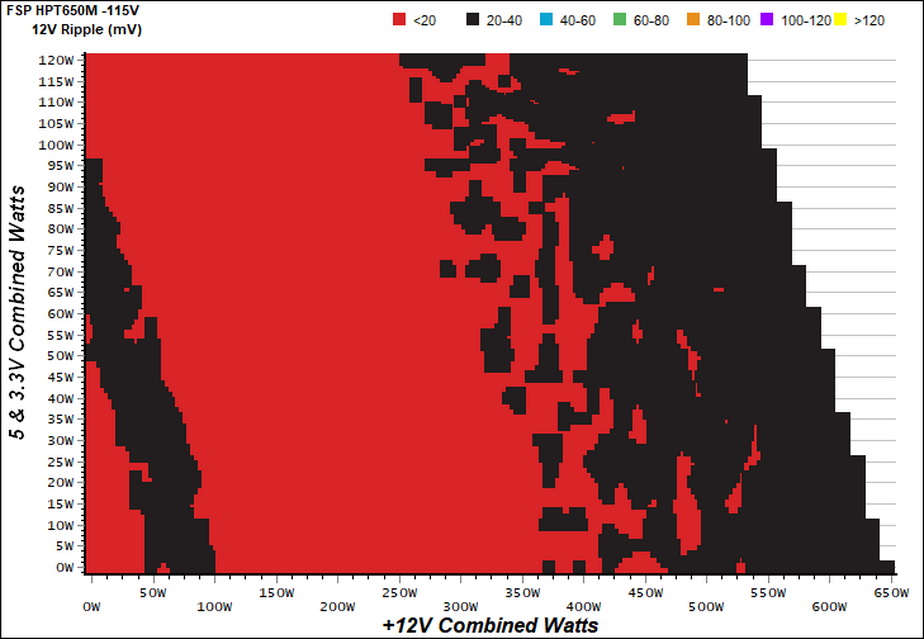
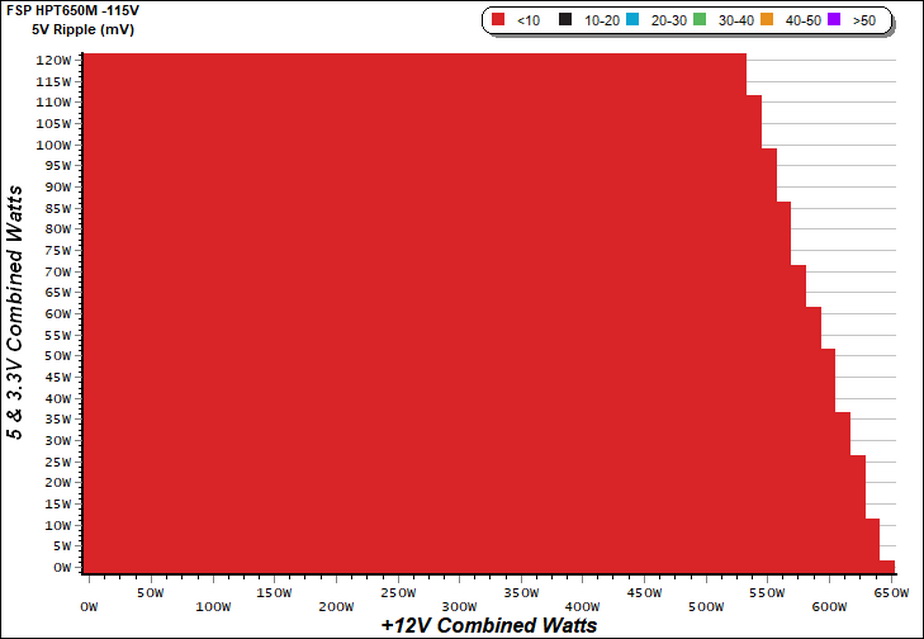
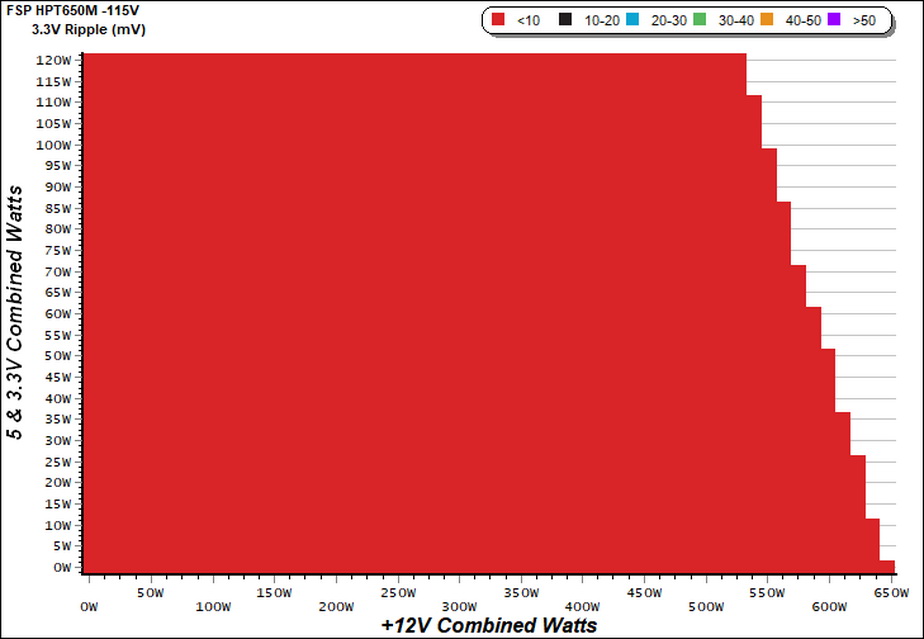
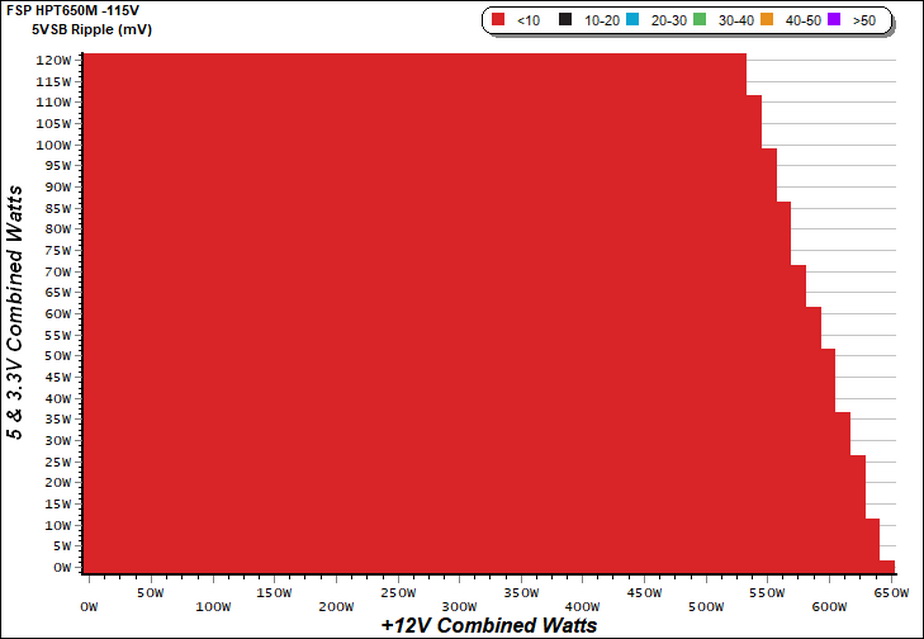
To generate the following charts, we set our loaders to auto mode through our custom-made software before trying more than 25,000 possible combinations with the +12V, 5V, and 3.3V rails. The load regulation deviations in each of the charts below are calculated by taking the nominal values of the rails (12V, 5V, and 3.3V) as point zero. The ambient temperature is between at 30°C (86°F) to 32°C (89.6°F).
Load Regulation Charts
Efficiency Chart
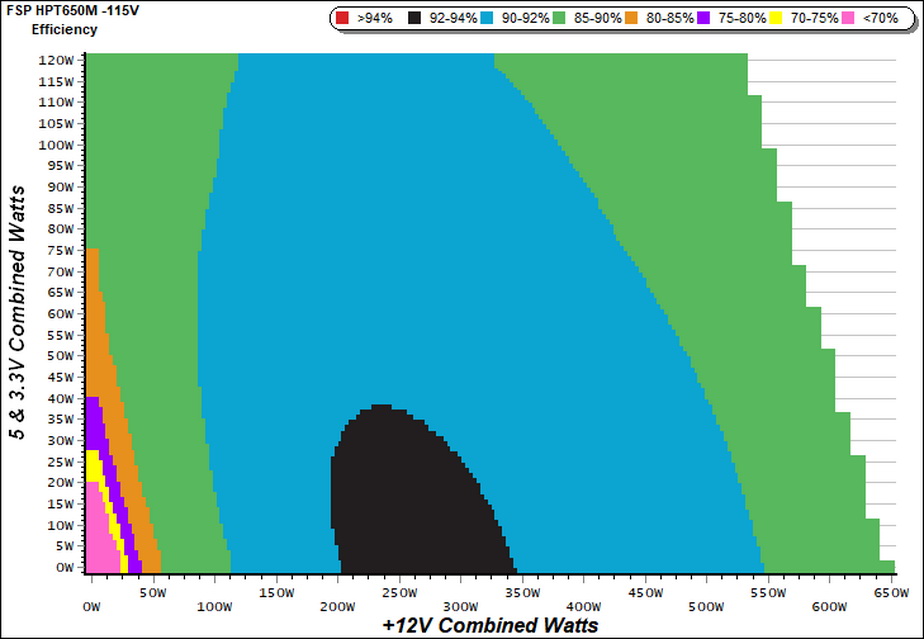
It is nice to see some of this chart reflecting >92% efficiency. The blue-colored region represents the 90-92% efficiency range, which is fairly large.
Ripple Charts
Infrared Images
We apply half-load for 10 minutes with the PSU's top cover and cooling fan removed before taking photos with our modified FLIR E4 camera that delivers 320x240 IR resolution (76,800 pixels).
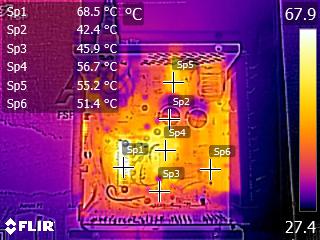
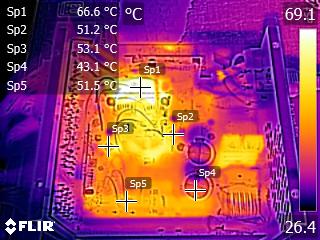
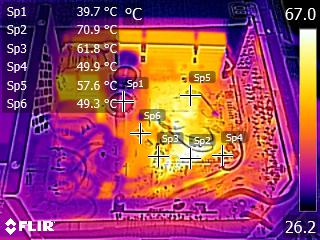
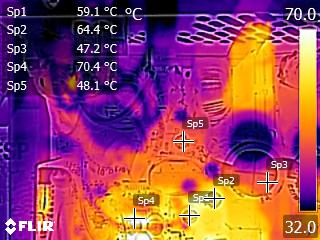
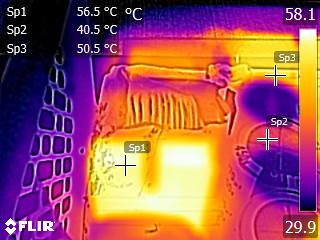
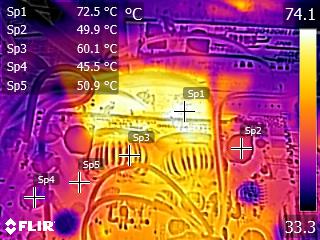
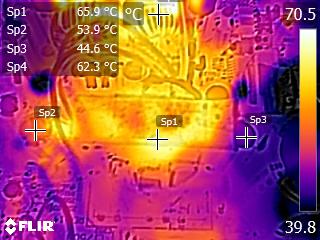
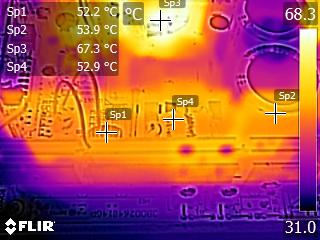
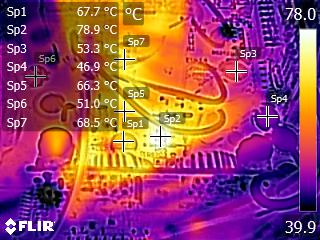
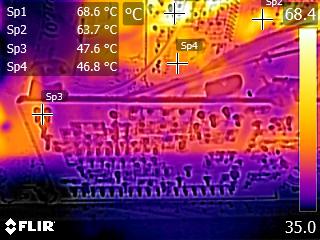
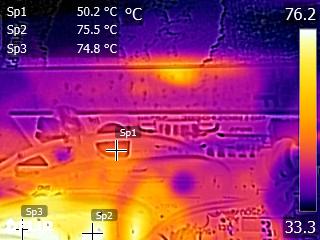
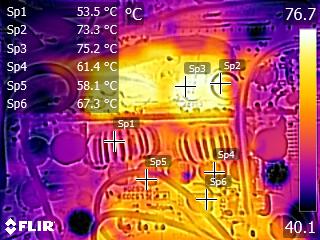
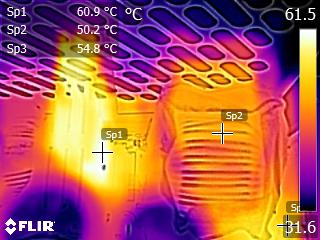
Temperatures remain low thanks to FSP's efficient platform. The hottest parts are the VRMs responsible for regulating the minor rails; we push them especially hard during our tests.
MORE: Best Power Supplies
MORE: How We Test Power Supplies
Get Tom's Hardware's best news and in-depth reviews, straight to your inbox.
MORE: All Power Supply Content
Current page: Cross-Load Tests and Infrared Images
Prev Page Protection Features and DC Power Sequencing Next Page Transient Response Tests
Aris Mpitziopoulos is a contributing editor at Tom's Hardware, covering PSUs.
