Why you can trust Tom's Hardware
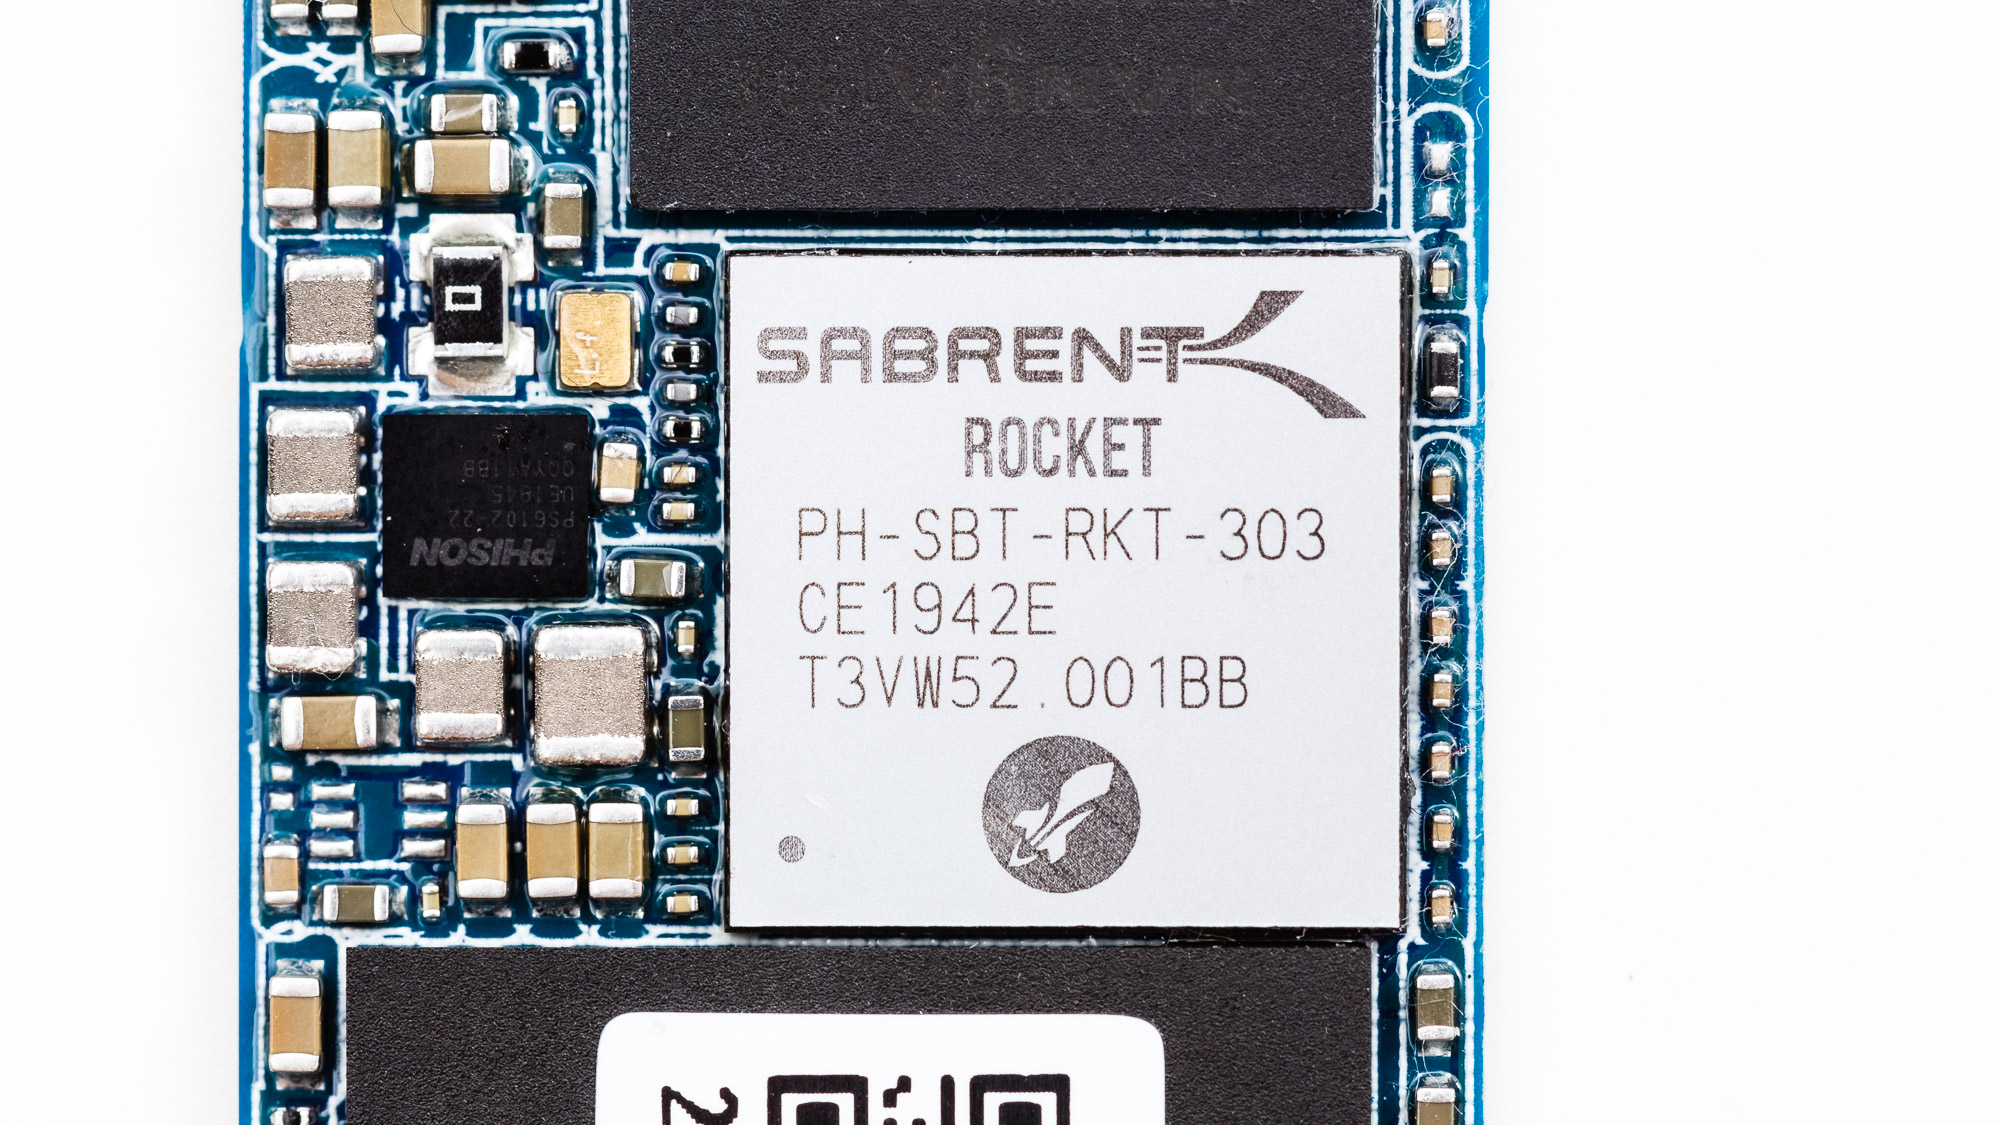
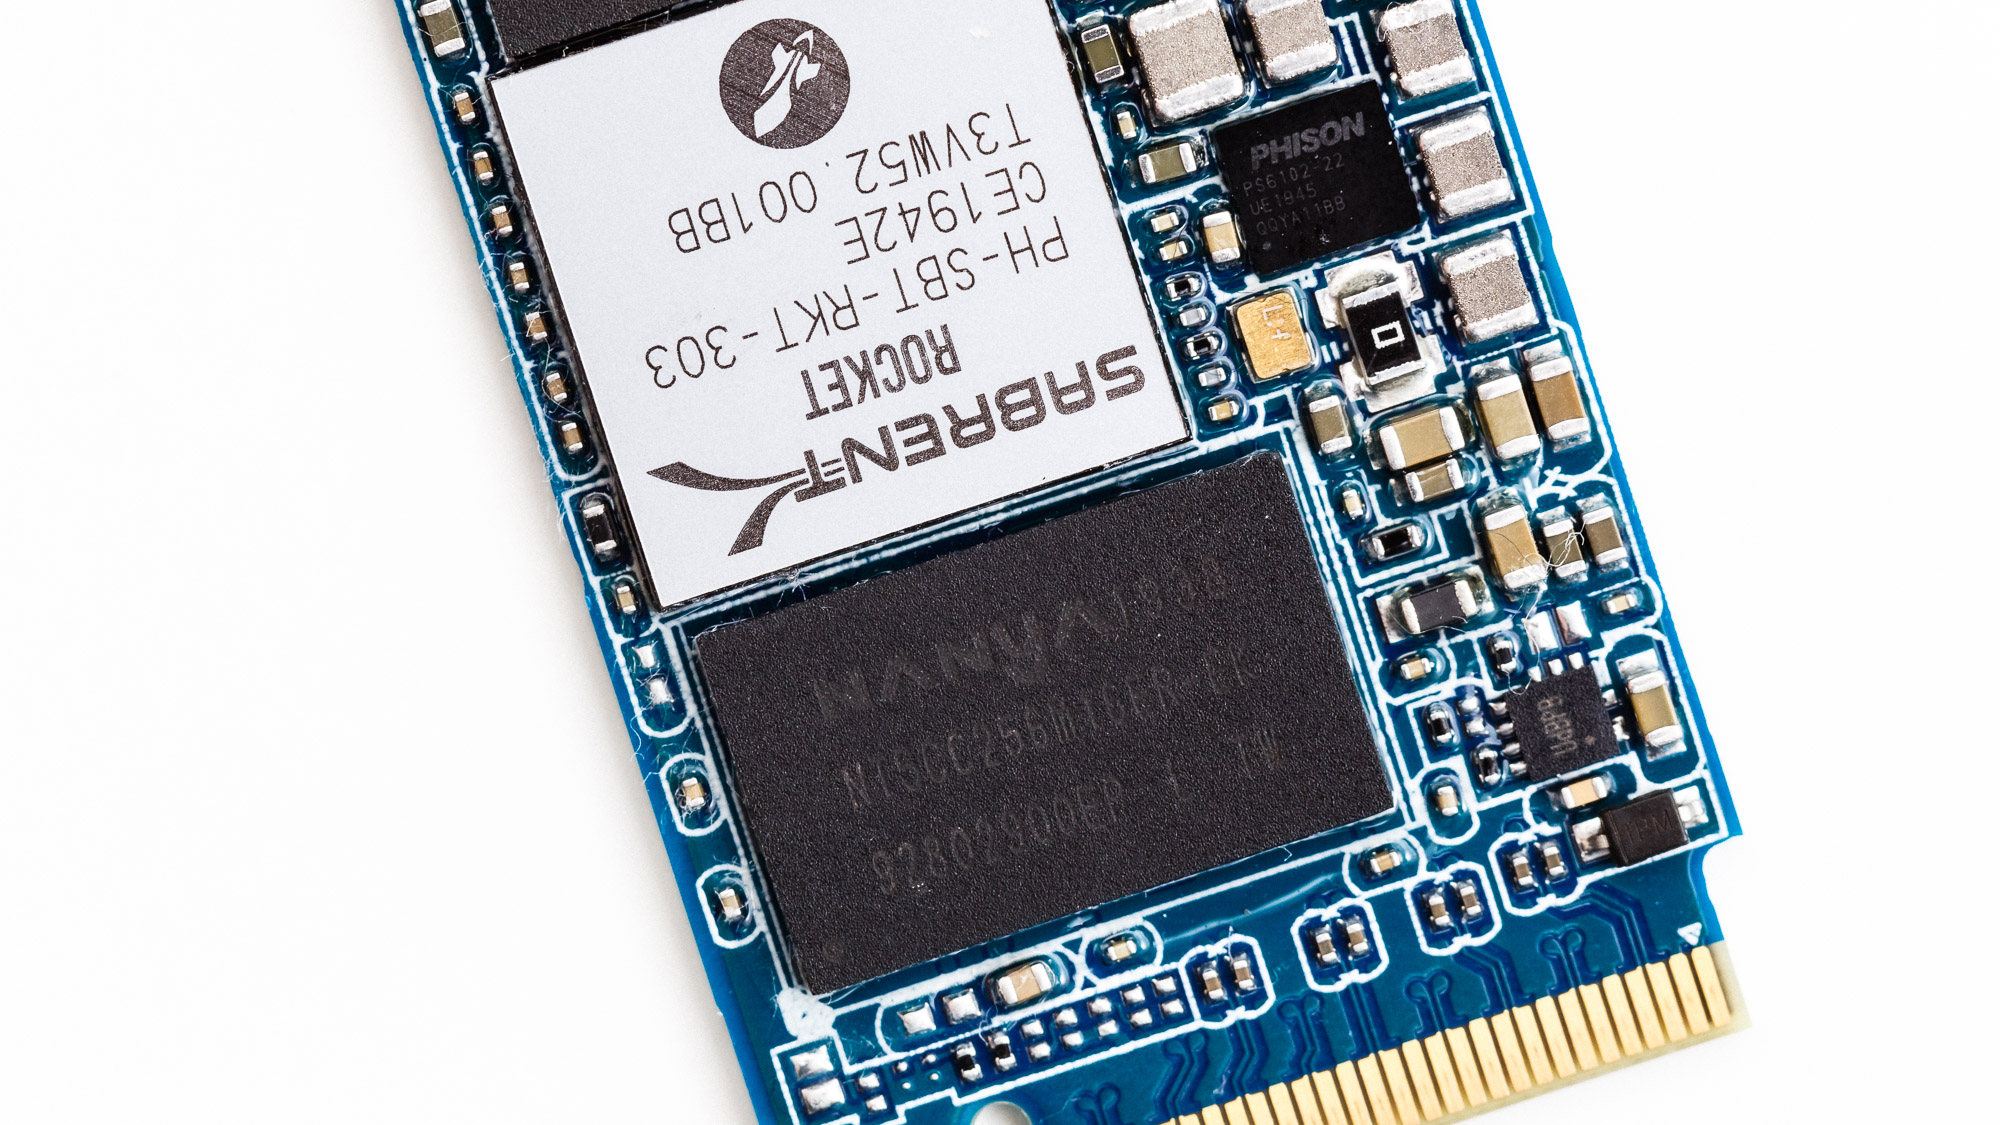
At $1,500, the 8TB monstrosity of an M.2 SSD will set you back the average price of a decent gaming laptop. But the Sabrent Rocket Q doesn't just push capacity to the highest we've seen with a slim M.2 SSD; it also impresses with the great performance and efficiency that comes courtesy of the new Phison E12S controller and 96L QLC flash.
QLC flash does have its downfalls, like lower endurance and slower write performance after the SLC write cache gets filled up during large file transfers, but the Phison E12S controller helps push the Rocket Q to the fastest performance we've seen from a QLC drive. The large dynamic write cache, a benefit of the massive capacity, also helps reduce the inherent performance issues that typically plague QLC SSDs.


There are a few things to keep in mind, though. The Rocket Q comes with a sophisticated LDPC error correction engine that helps provide viable write endurance during the warranty period. However, it's still about one-half to one-third of normal TLC SSD endurance. The warranty is a bit tricky, too. The drive comes with a one-year warranty, but you can extend that to five years if you register the drive within the first 90 days of purchase. That's a bit of a hassle.
Adata's XPG SX8200 Pro is a close competitor. Adata uses a very responsive overclocked SMI controller and Micron's equally-responsive TLC flash, so the SX8200 Pro is the better buy if you're looking for higher performance and longevity. The 2TB SX8200 Pro costs only a few dollars more at $260, which is well worth considering given the benefit of TLC flash. Otherwise, if you want to save a few bucks, the Rocket Q is close on performance and costs less. It even beats the WD Black SN750.
The same goes if you compare the Rocket Q to most other low-cost QLC NVMe and SATA competitors. The Sabrent Rocket Q M.2 NVMe SSD offers a lot of performance for your dollar against Intel's 660p, 665p, and Crucial's P1, and WD's Blue 3D.
But many people looking at the Sabrent Rocket Q are probably interested in its big capacity: The 8TB model leads the market in such a form factor. The only real drawback, besides the typical slow write speed we see with QLC SSDs after the write cache fills, is its hefty $1,500 price tag. Intel's Optane SSD 905P stands out as the only drive that can command such high pricing, but it doesn't offer the sheer capacity of the Rocket Q.
While it can't beat the mainstream TLC NAND-based SSDs in terms of write endurance, as long as the workload is within its cache, Sabrent's Rocket Q will perform wonderfully.
Get Tom's Hardware's best news and in-depth reviews, straight to your inbox.
Sabrent's Rocket Q qualifies as one of the best bang-for-your-buck M.2 SSDs in the entry-level segment. You can pick and choose from the different capacity points, offering an upgrade for almost any budget. It can set you back a month's worth of rent for the spacious 8TB model, though.
MORE: Best SSDs
MORE: How We Test HDDs And SSDs
MORE: All SSD Content

Sean is a Contributing Editor at Tom’s Hardware US, covering storage hardware.
-
MartinBarcelona Good news, 1/4 of the drive being slc (to use as cache) is alot.. so best drive .. for such capacity..Reply
Sabrent’s Rocket Q features a massive dynamic SLC write cache that spans a quarter of the SSD’s available capacity. The 8TB Rocket Q wrote a little over 2.1TB of data at 2.9 GBps before degrading to an average speed of 276 MBps after the write cache filled. -
gio2vanni86 Saw linus put this thing through a test. Seems fast. And the storage is heading into the right direction. The only problem i see is the same one i saw back in 2010... $$$$. Thats a steep price to swallow.Reply -
geogan Considering how much disc recovery firms charge to attempt to recover data from failed normal SATA drives... I'd love to see how much they would charge to try and recover all 8TB of your data when this fails... if you have something like this you 100% also need to budget another couple hundred for a 10TB backup SATA drive.Reply
I have seen ridiculous prices from some of these recovery companies like charging 500 straight up then and more to pay for the clone drive plus something like $75 for each TB over 1TB to recover. I calculated the cost of restoring a bog standard 6TB WD drive at over $1000 which for a drive that cost me $150 second hand is just <Mod Edit> ridiculous. They are gougers, talking advantage of people being desperate to recover their precious recordings/pictures/data. Don't give them the chance. -
mik1 Tomshardware, I can't find any latency measurements per read operation out there! As in you give the SSD a 4K aligned read command, how many milliseconds will it take for it to respond.Reply
I believe it is ballpark 0.5 milliseconds which is the typical for most recent M.2 NVMe SSDs currently (and Optane leads with 0.01), can you please confirm? -
seanwebster Reply
Double check the iometer /synthetic testing section of the benchmark pages, it should be there.mik1 said:Tomshardware, I can't find any latency measurements per read operation out there! As in you give the SSD a 4K aligned read command, how many milliseconds will it take for it to respond.
I believe it is ballpark 0.5 milliseconds which is the typical for most recent M.2 NVMe SSDs currently (and Optane leads with 0.01), can you please confirm? -
mik1 @seanwebster I reviewed page 2 and 3 carefully now and there are now IO latency numbers there.Reply
If there would have been any screenshots of IOMeter, I presume they would have shown the latency, but none are published. -
seanwebster Reply
I don’t take screenshots of the iometer results, I log them and sort through the raw data to chart it instead.mik1 said:@seanwebster I reviewed page 2 and 3 carefully now and there are now IO latency numbers there.
If there would have been any screenshots of IOMeter, I presume they would have shown the latency, but none are published. -
mik1 @seanwebster i don't see any latency chart, did you provide one?Reply
(I only see the "tracing testing", maybe that depends on latency and so reflects it, i'd greatly appreciate an actual latency metric though) -
seanwebster Replymik1 said:@seanwebster i don't see any latency chart, did you provide one?
(I only see the "tracing testing", maybe that depends on latency and so reflects it, i'd greatly appreciate an actual latency metric though)
It isn't under trace testing, it is under "synthetic testing - iometer," as mentioned previously. You need to look through the gallery for the 4K random QD1 response latency. Sequential read is only the first image of the iometer gallery.
I've attached the 8TB results from the review.