Why you can trust Tom's Hardware
Comparison Products
We lined the massive 8TB Sabrent Rocket Q up against the 2TB model as well as a bunch of the Best SSDs on the market. We include Sabrent’s Rocket NVMe 4.0 SSD, a PCIe 4.0 x4 beast, and the extremely expensive 1.5TB Intel Optane SSD 905P that offers the fastest performance you can buy. We also threw in a 2TB Samsung 970 EVO Plus, WD Black SN750, and Adata XPG SX8200 Pro as high-end competitors. We added in Crucial’s MX500 for good measure.
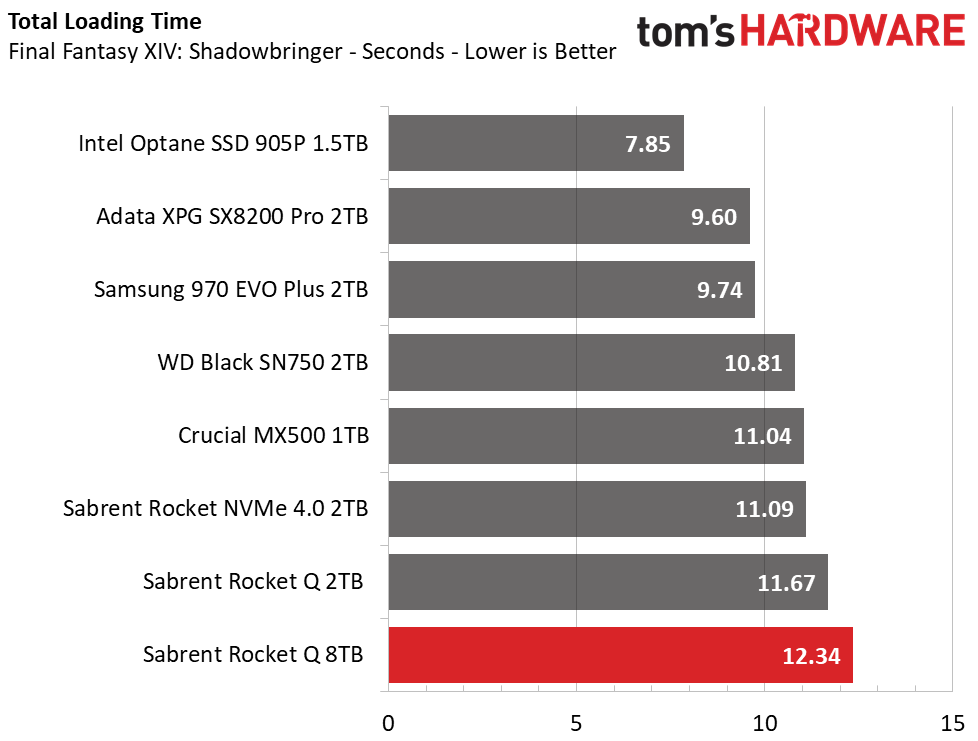
Game Scene Loading - Final Fantasy XIV
Final Fantasy XIV Stormbringer is a free real-world game benchmark that easily and accurately compares game load times without the inaccuracy of using a stopwatch.
Sabrent’s Rocket Q delivers responsive game load times, but it isn’t the fastest SSD on the market. Intel’s Optane SSD 905P delivers the fastest game load times, but Adata’s SM2262EN-powered XPG SX8200 Pro and Samsung’s 970 EVO Plus both give it a good run for its money with total game load times under 10 seconds. With a total load time of 12.34 seconds, the 8TB Sabrent Rocket Q slightly lags the 2TB model, ranking last.
Transfer Rates - DiskBench
We use the DiskBench storage benchmarking tool to test file transfer performance with our own custom block of data. Our 50GB data set includes 31,227 files of various types, like pictures, PDFs, and videos. Our 100GB includes 22,579 files with 50GB of them being large movies. We copy the data sets to new folders and then follow-up with a read test of a newly-written 6.5GB zip file and 15GB movie file.
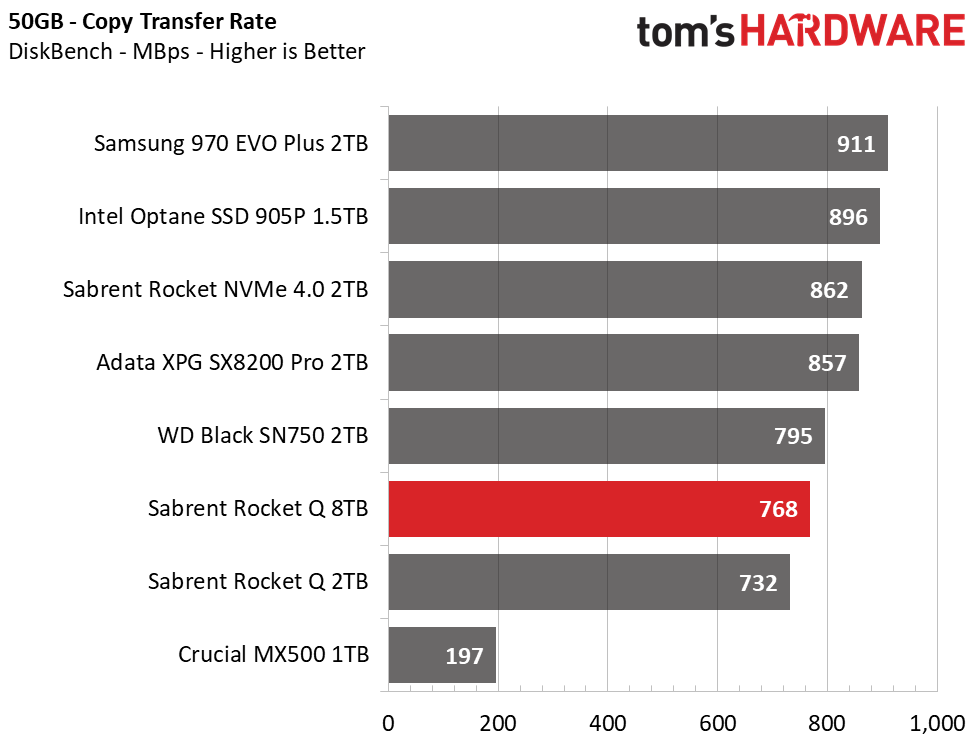
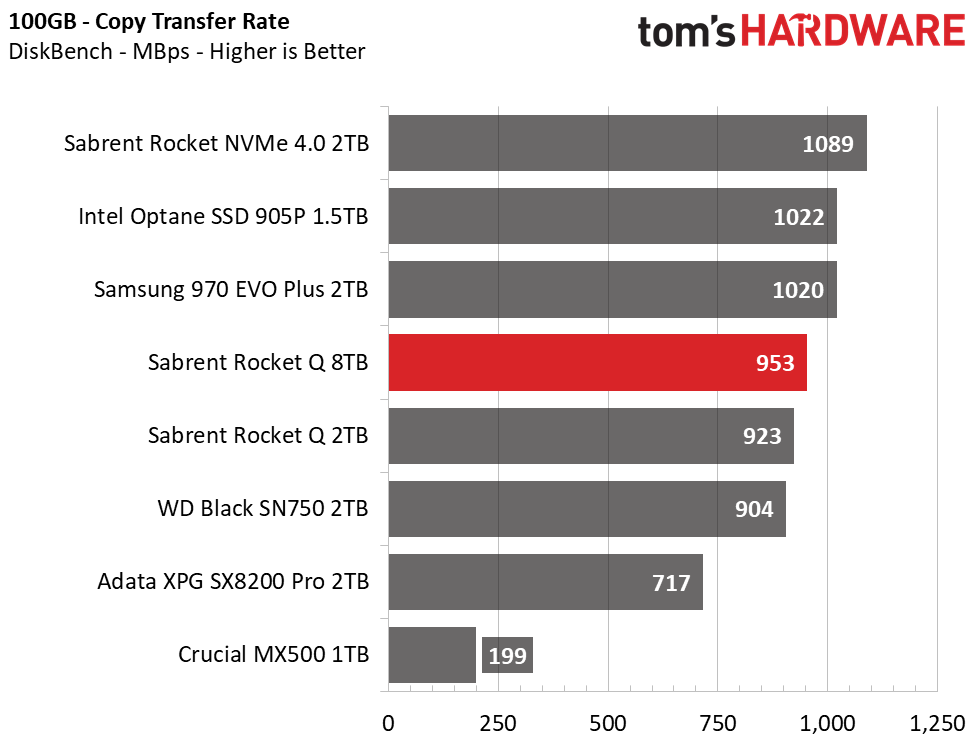
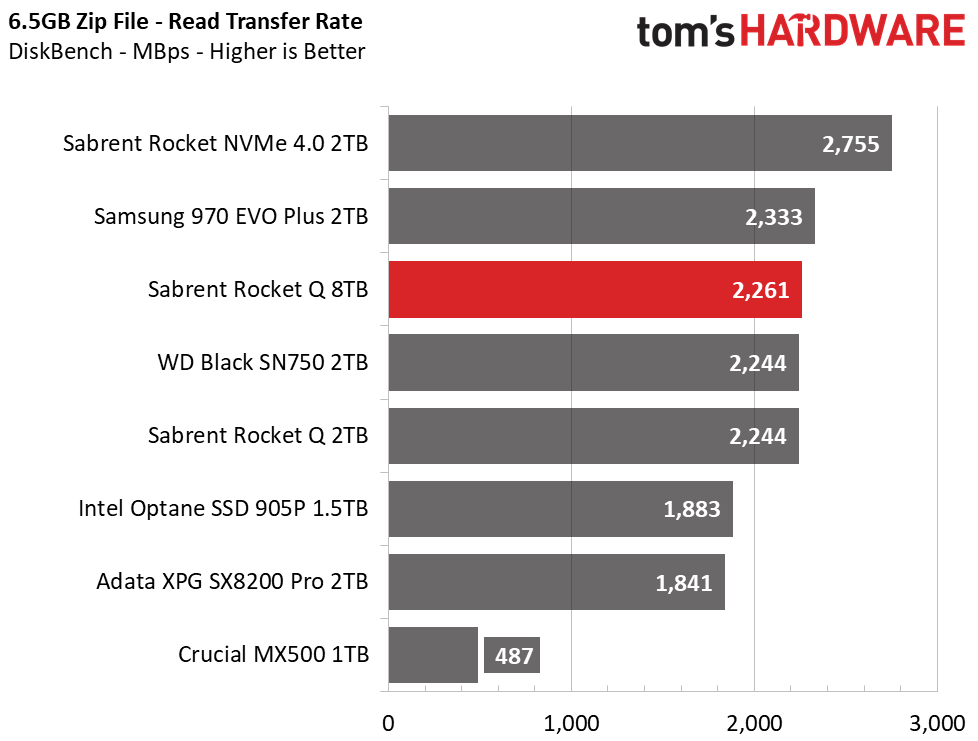
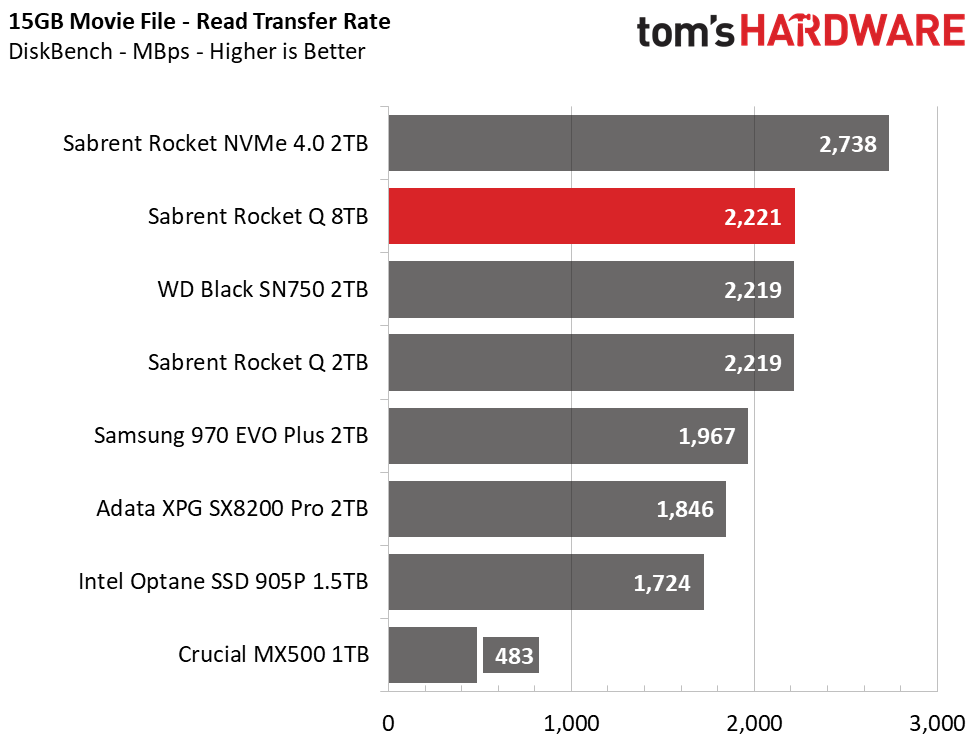
With 8TB of capacity and a large write cache to power massive file transfers, our 50GB and 100GB transfers barely scratch the 8TB Rocket Q’s potential. The Rocket Q wasn’t as fast at copying large files as the Samsung 970 EVO Plus, Sabrent Rocket NVMe 4.0, or Intel Optane SSD 905P, but with speeds that are faster than the 2TB model and similar to WD’s Black SN750, it should do well for most moderate use. Not to mention, Sabrent’s Rocket Q delivers some of the fastest sequential read performance we have seen from a PCIe 3.0 x4 NVMe SSD.
Trace Testing - PCMark 10 Storage Tests
PCMark 10 is a trace-based benchmark that uses a wide-ranging set of real-world traces from popular applications and common tasks to measure the performance of storage devices. The quick benchmark is more relatable to those who use their PCs lightly, while the full benchmark relates more to power users. If you’re using the device as a secondary drive, the data test will be most relevant.
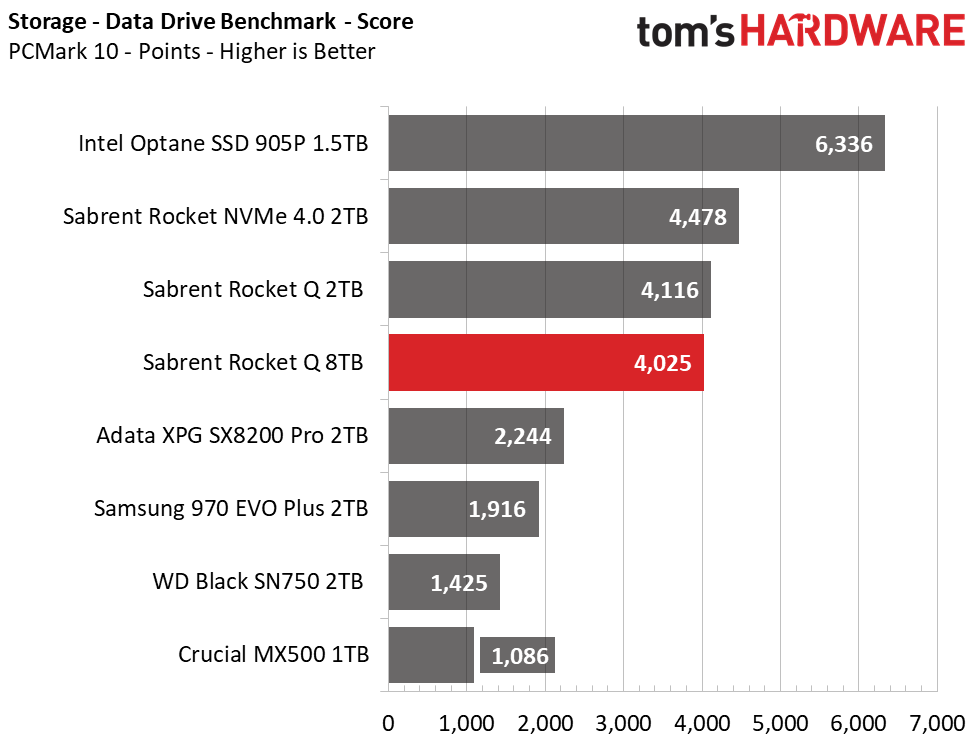
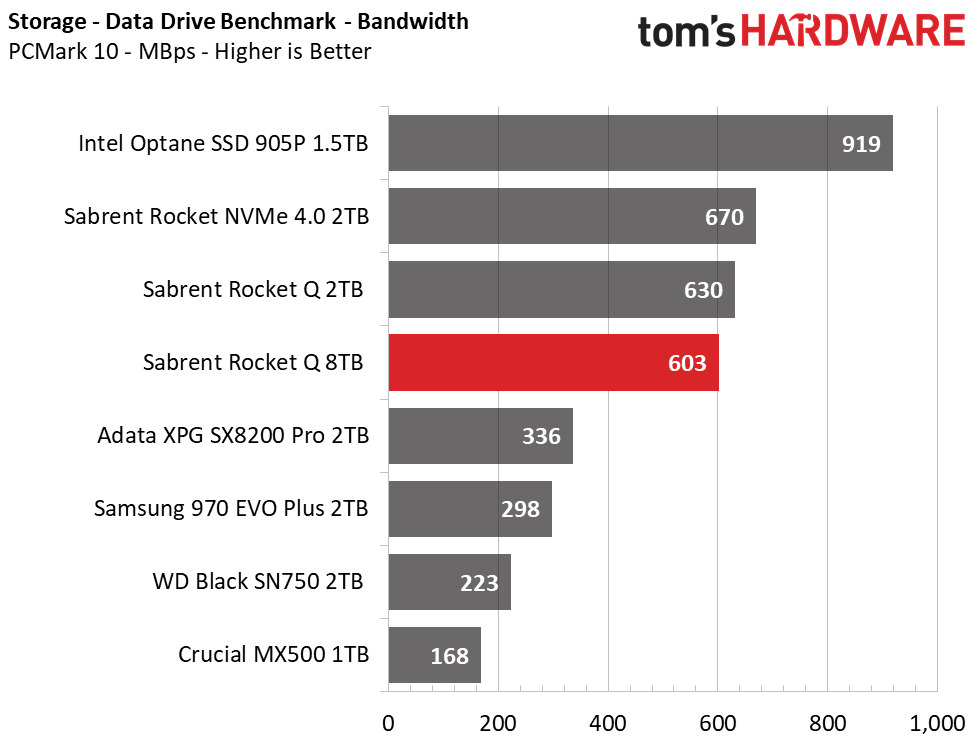
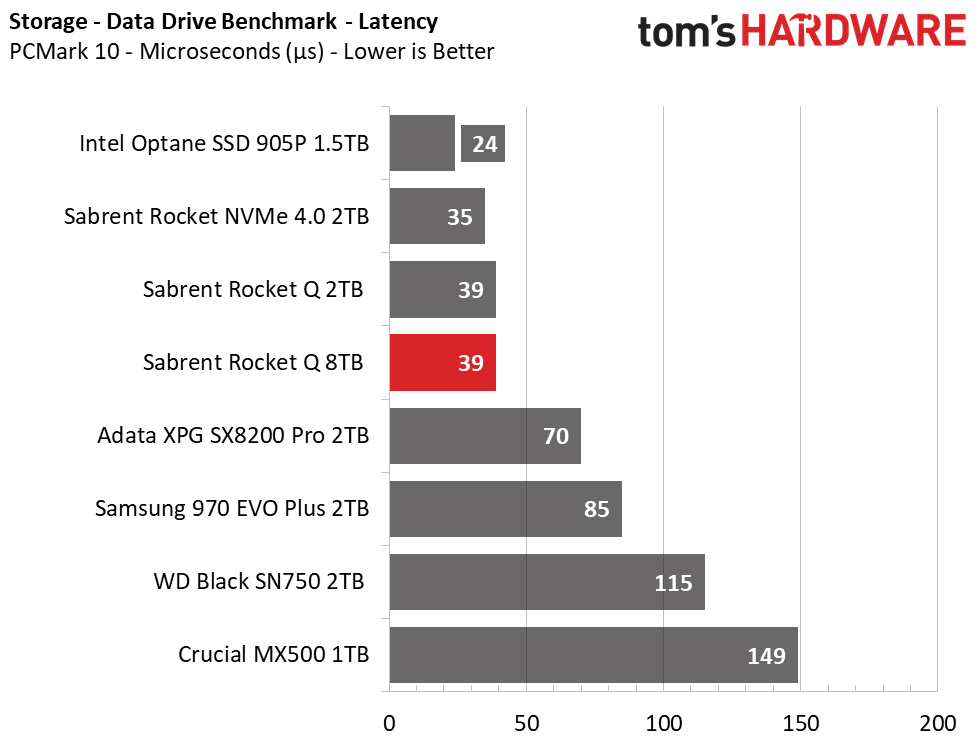
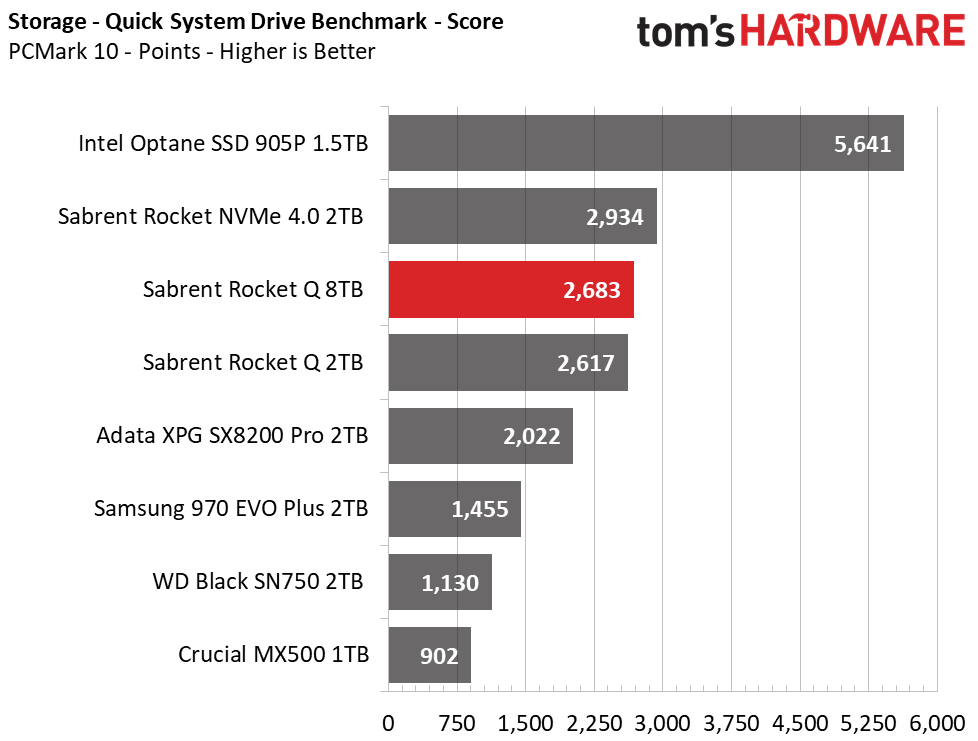
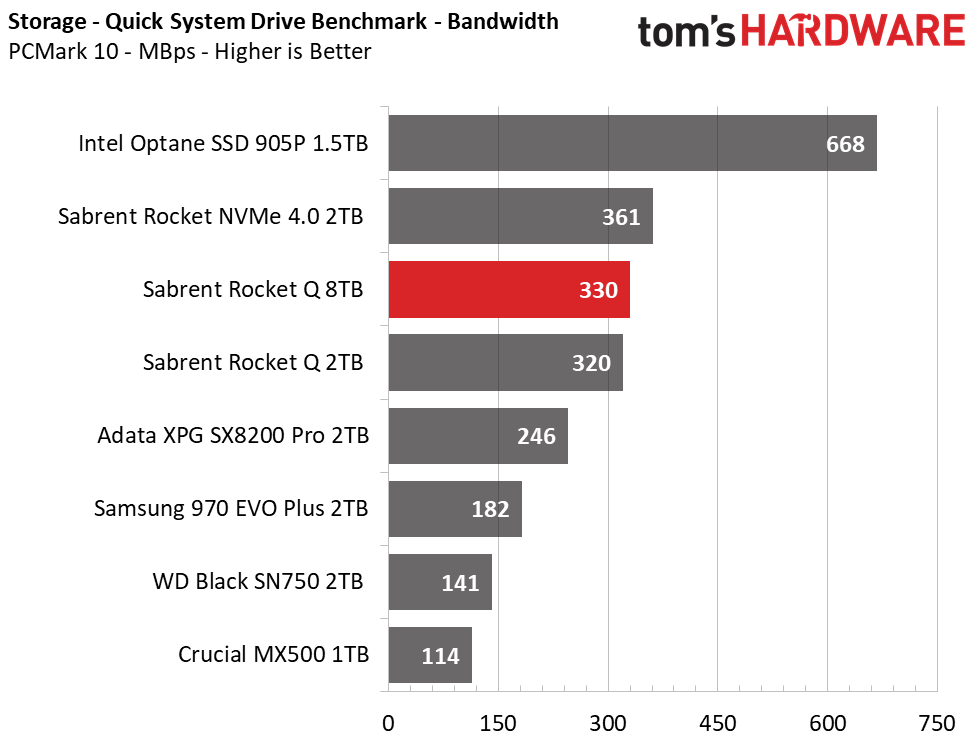
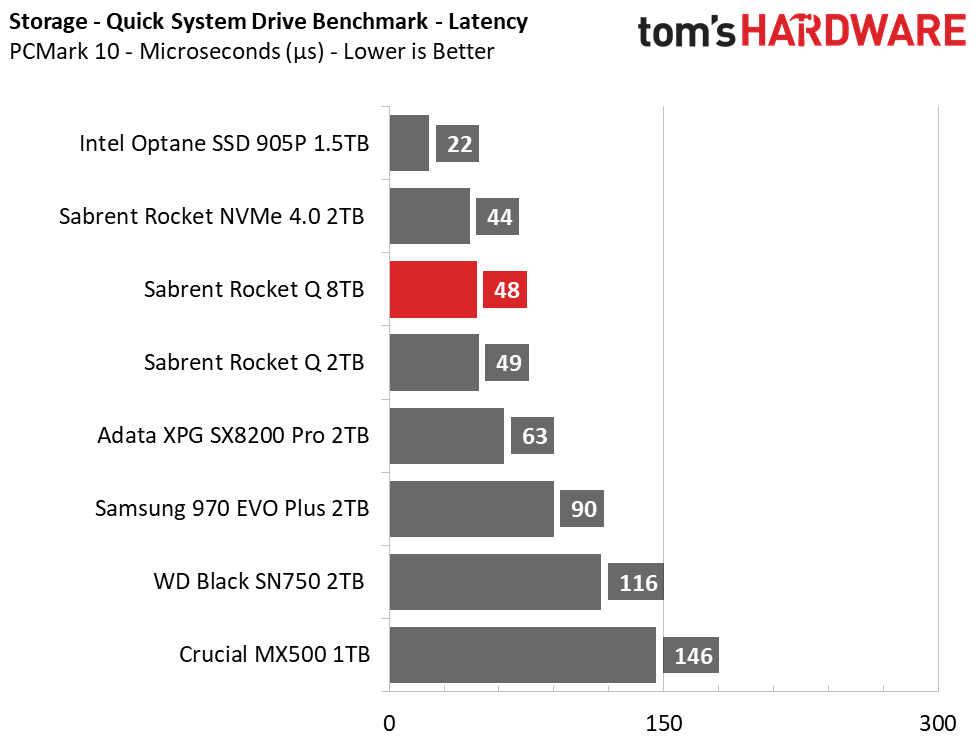
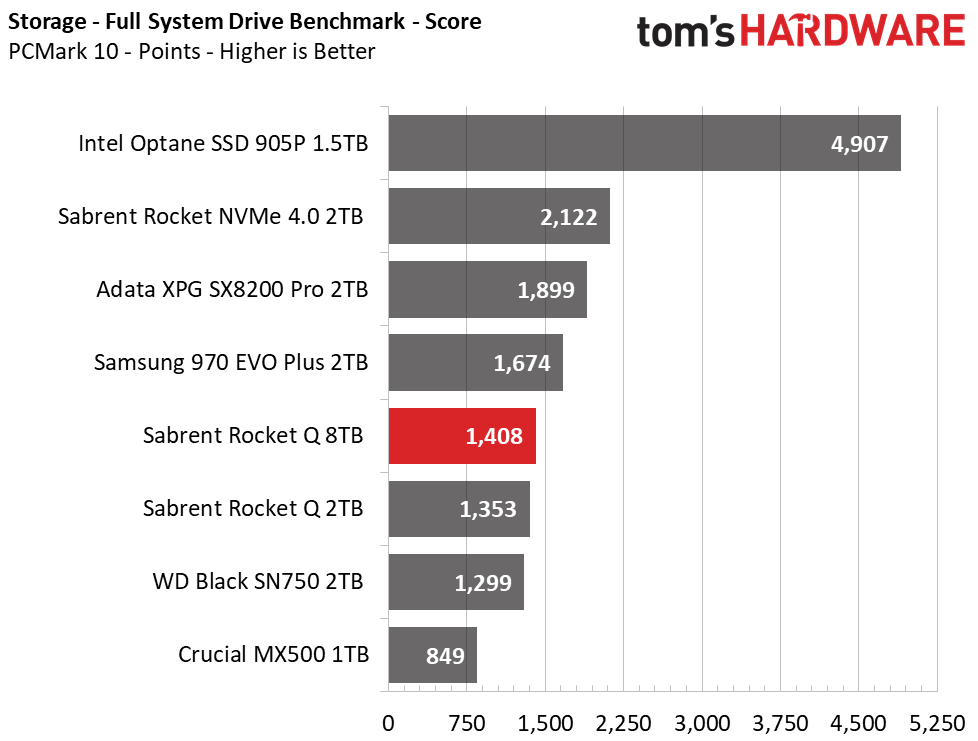
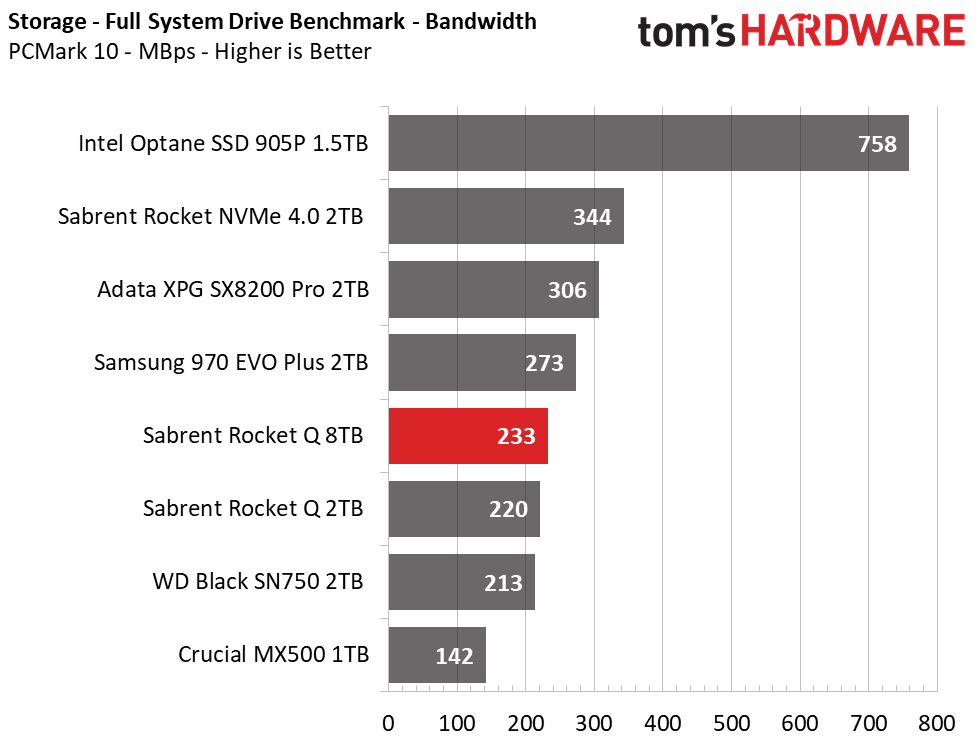
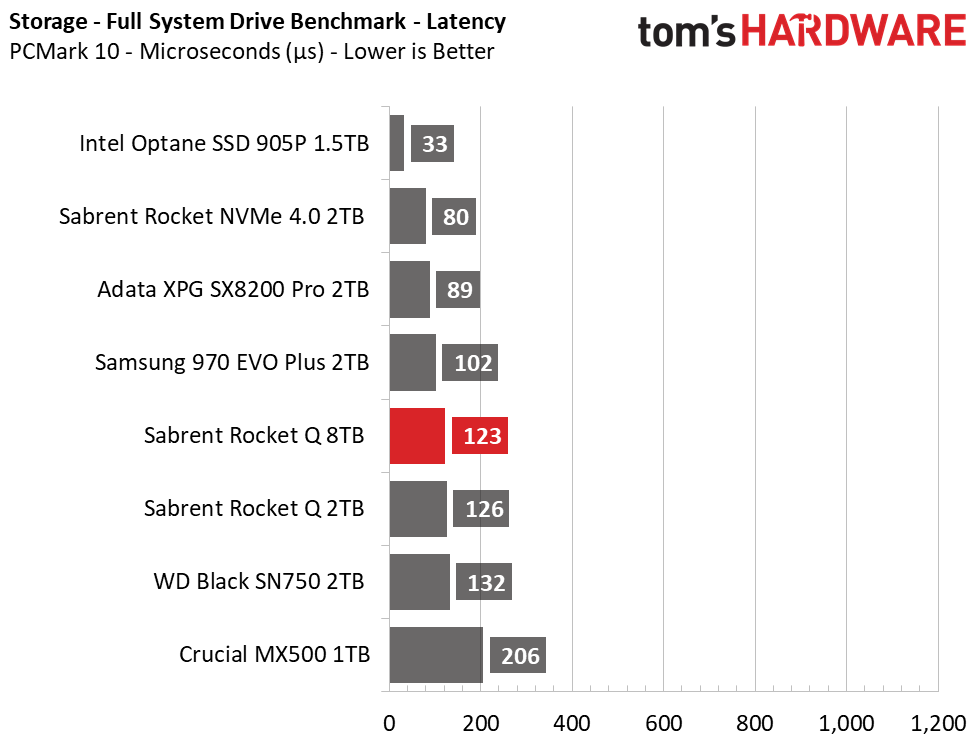
Scoring fourth and third place in PCMark 10’s Data Drive and Quick System Drive benchmarks, respectively, Sabrent’s 8TB Rocket Q proved very responsive during light workloads. The 8TB Rocket Q fell back when we pushed harder with PCMark 10’s Full system Drive benchmark, though.
Get Tom's Hardware's best news and in-depth reviews, straight to your inbox.
Adata’s XPG SX8200 Pro and Samsung’s 970 EVO Plus gain the edge under this heavier use case, but the Rocket Q still surpasses the WD Black SN750 and outscores the 2TB Sabrent Rocket Q.
Trace Testing - SPECworkstation 3
Like PCMark 10, SPECworkstation 3 is a trace-based benchmark, but it is designed to push the system harder by measuring workstation performance in professional applications.
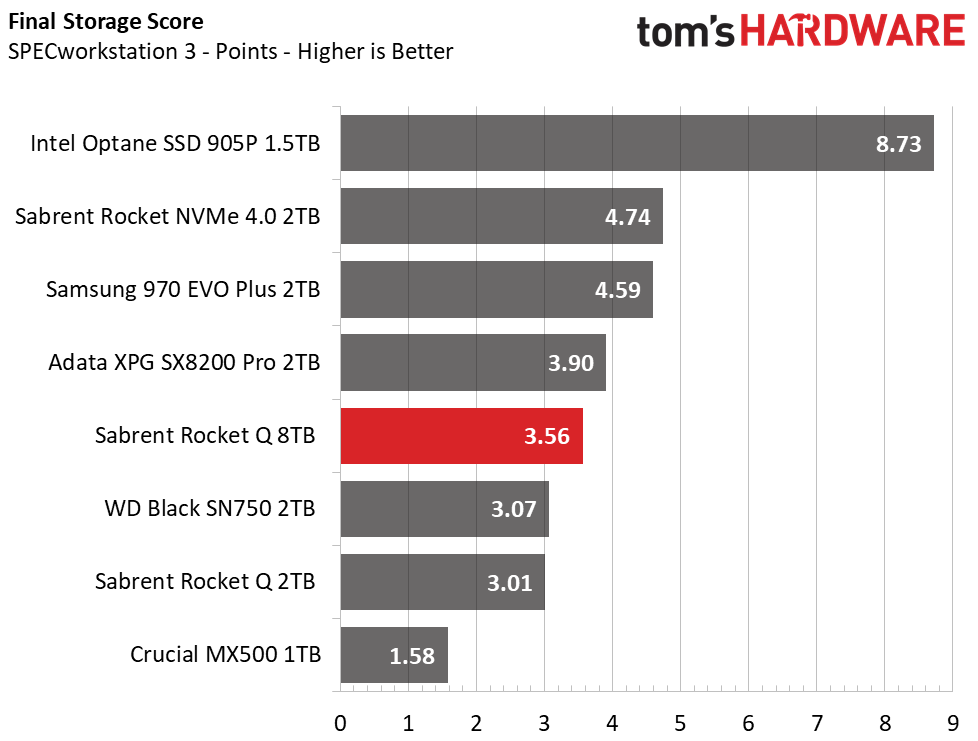
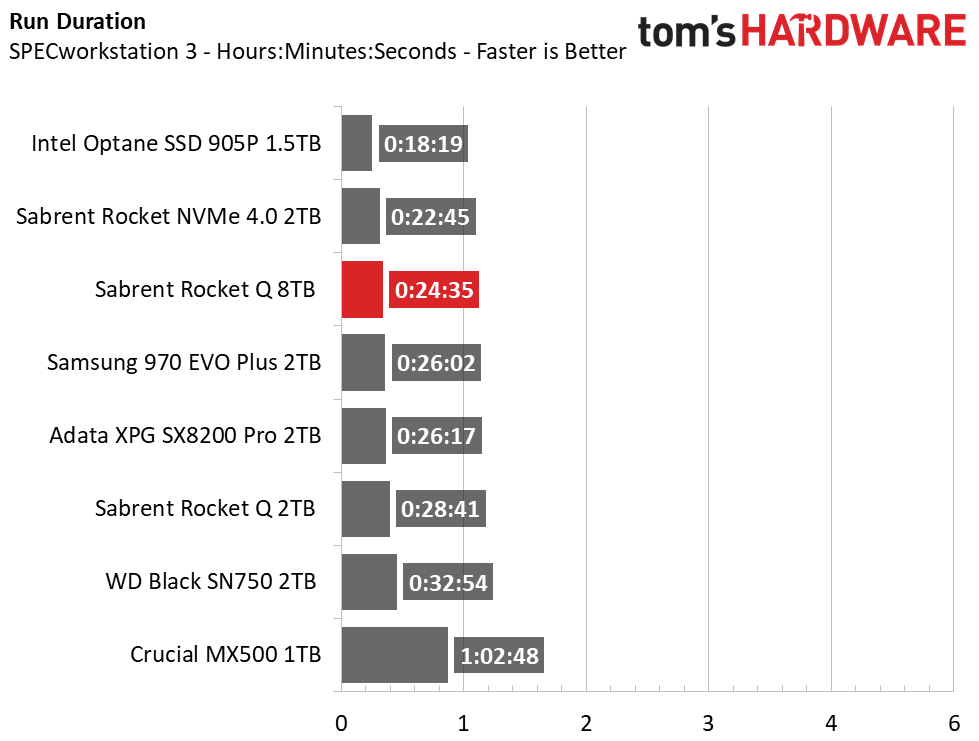
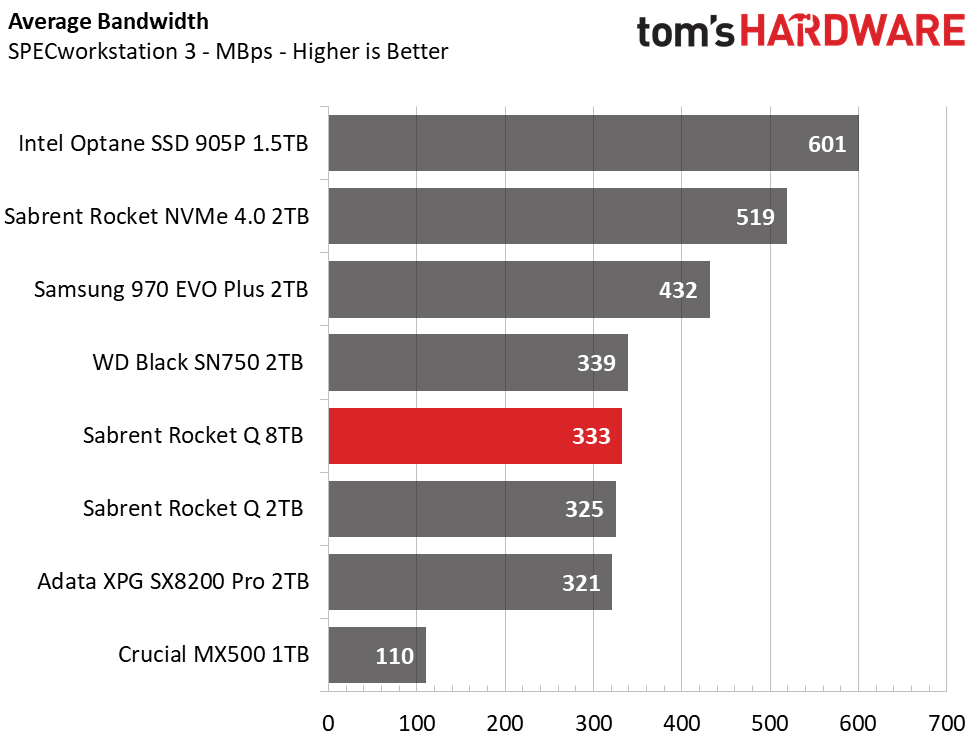
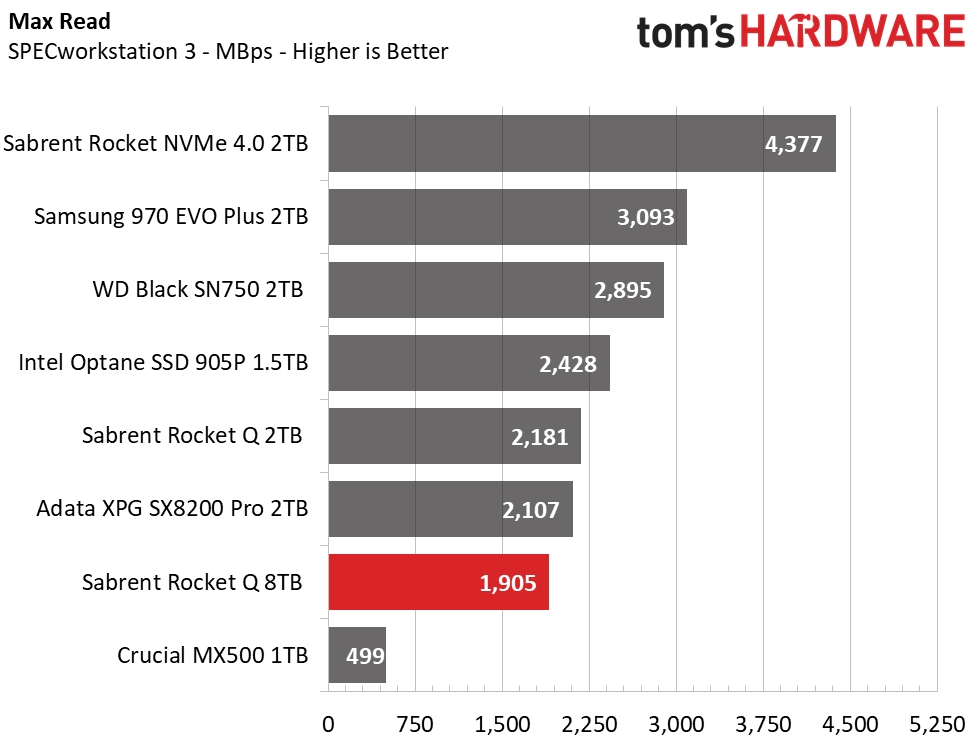
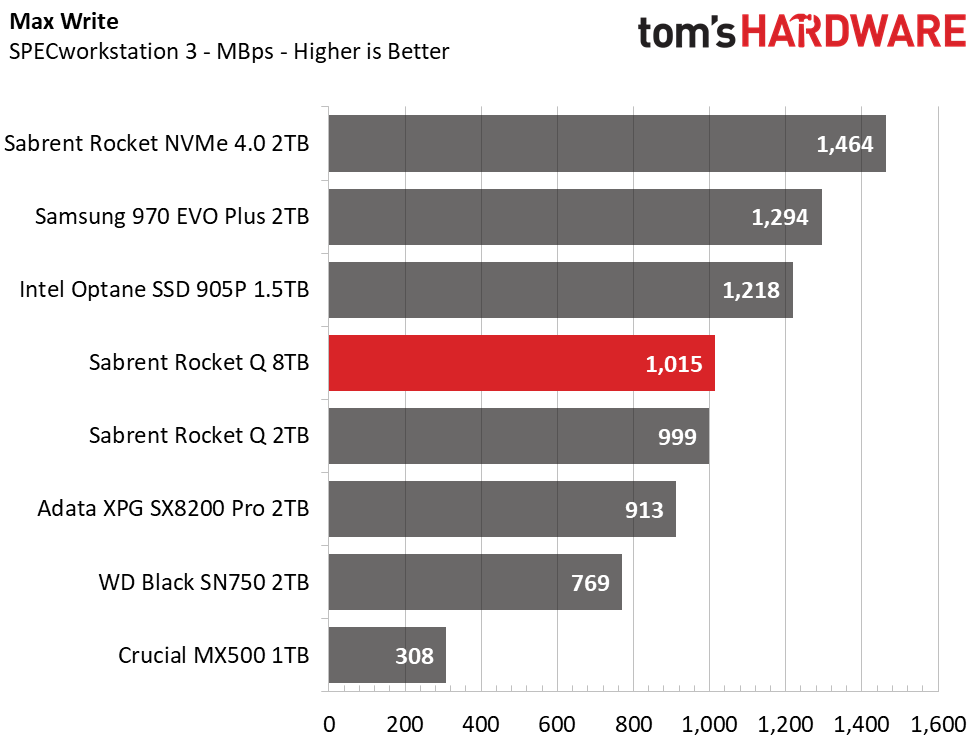
With multi-gigabyte per second performance at its disposal, Sabrent’s 8TB Rocket Q powers through the benchmark faster than the Samsung 970 EVO Plus, Adata XPG SX8200 Pro, and WD Black SN750. With slower peak read and write performance and higher latency under some of the workloads, it scores lower than the TLC competition. Sabrent’s Rocket Q isn’t necessarily meant to be hammered by prosumer workloads, but it should do fairly well in a variety of tasks.
Synthetics - ATTO
ATTO is a simple and free application that SSD vendors commonly use to assign sequential performance specifications to their products. It also gives us insight into how the device handles different file sizes.
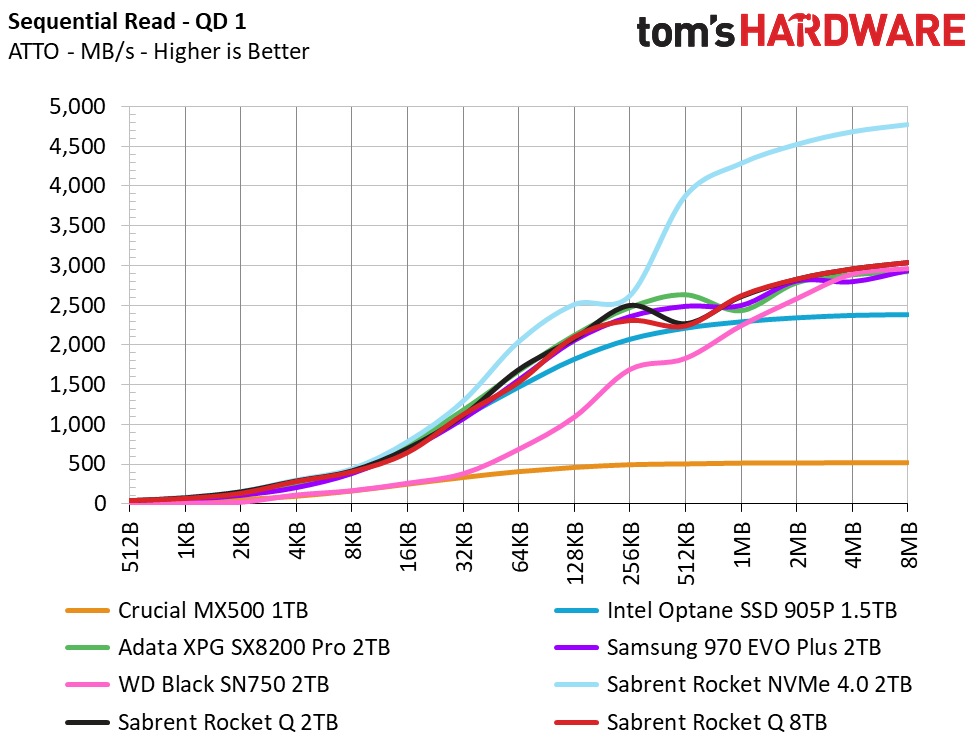
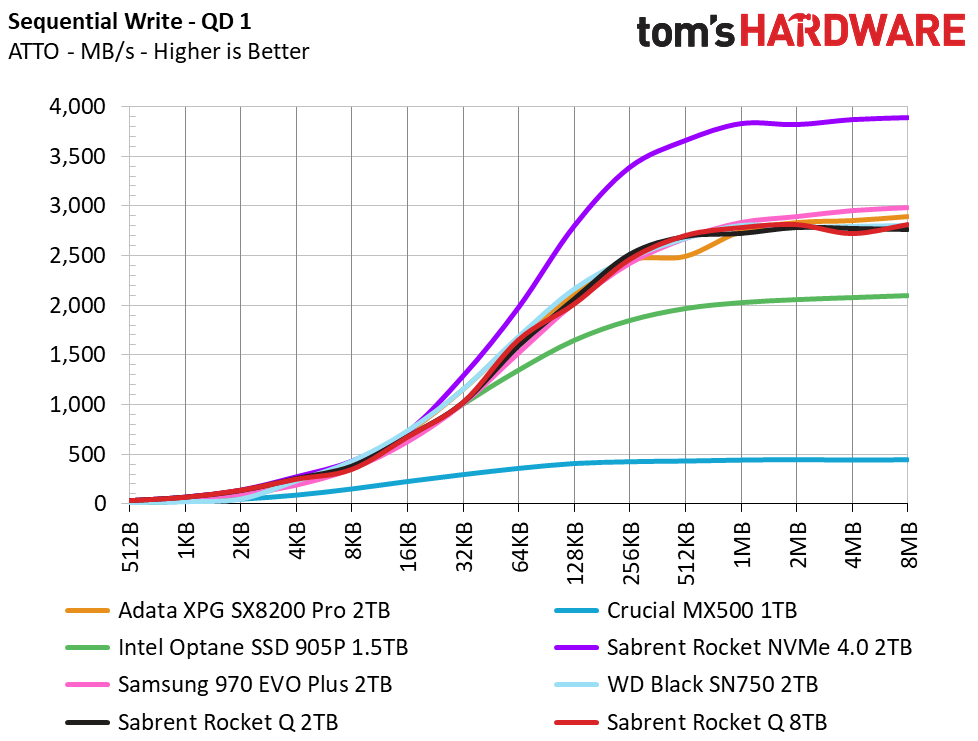
We tested Sabrent’s 8TB Rocket Q at a queue depth (QD) of 1, representing most day-to-day file accesses at various block sizes. The 8TB Rocket Q performs similarly to the 2TB model and offers similar performance to its competitors. Sequential performance peaks at around 3/2.8 GBps read/write, besting the Intel Optane SSD 905P.
Synthetic Testing - iometer
iometer is an advanced and highly configurable storage benchmarking tool that vendors often use to measure the performance of their devices.
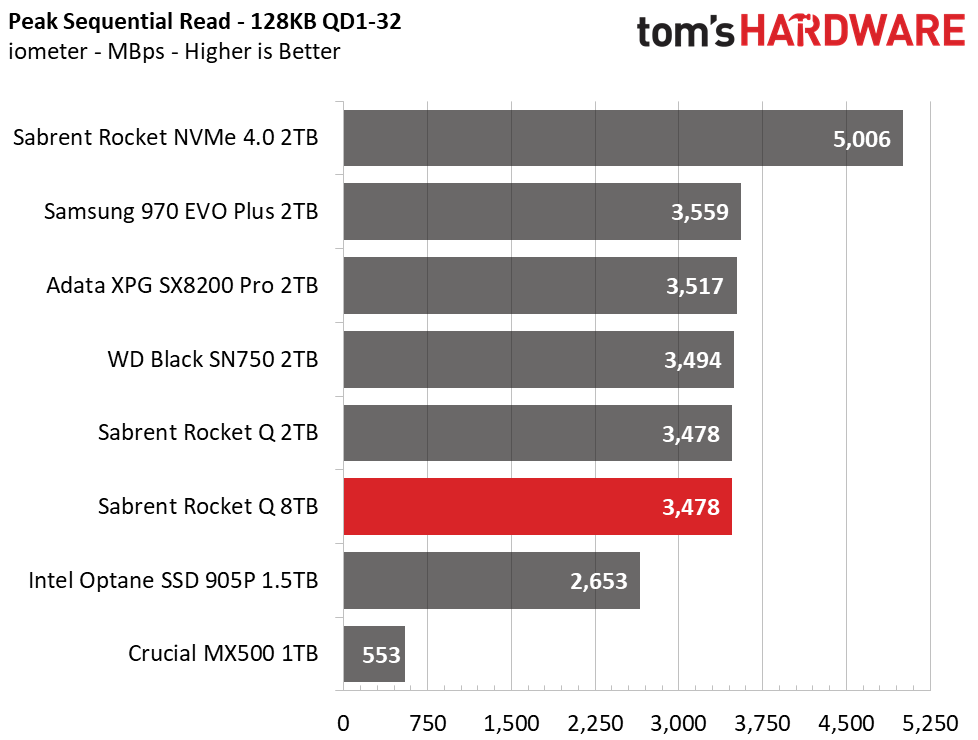
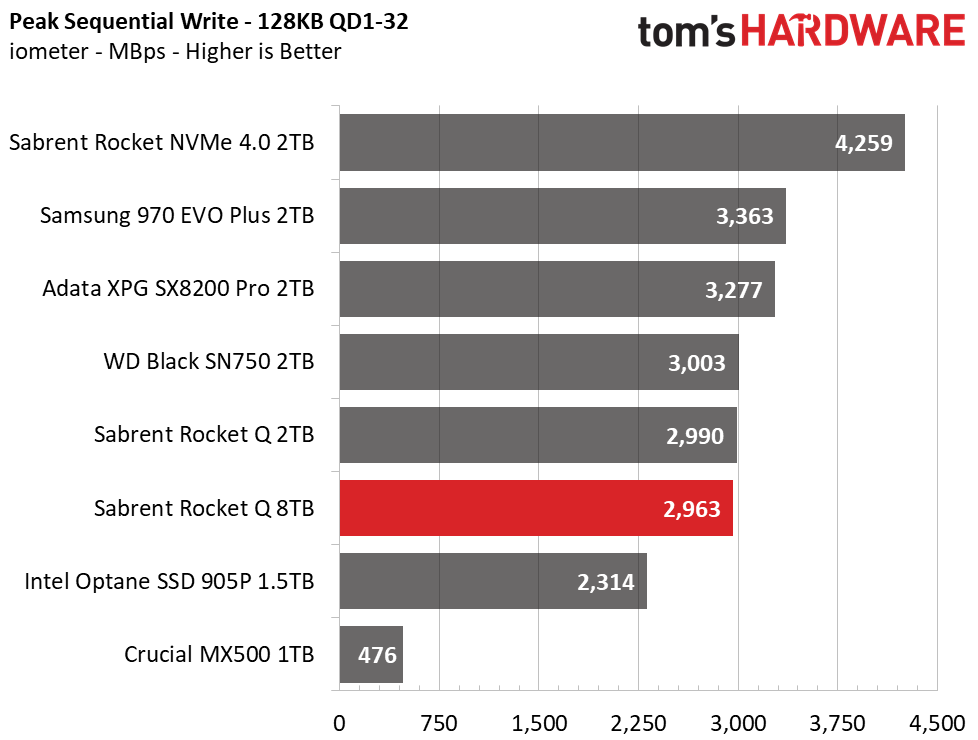
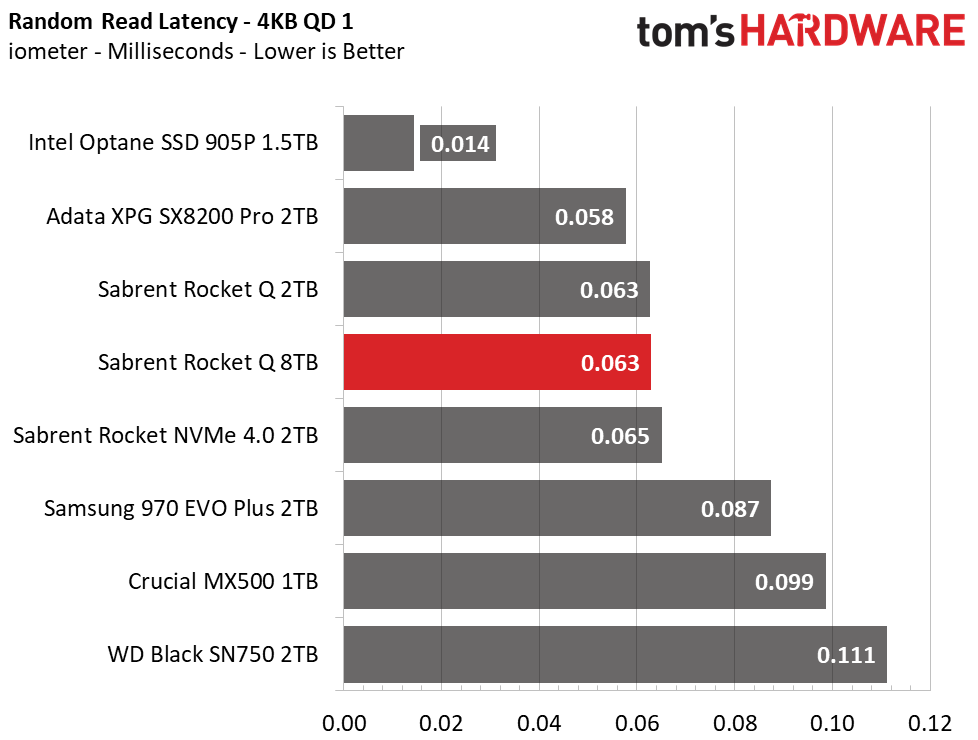
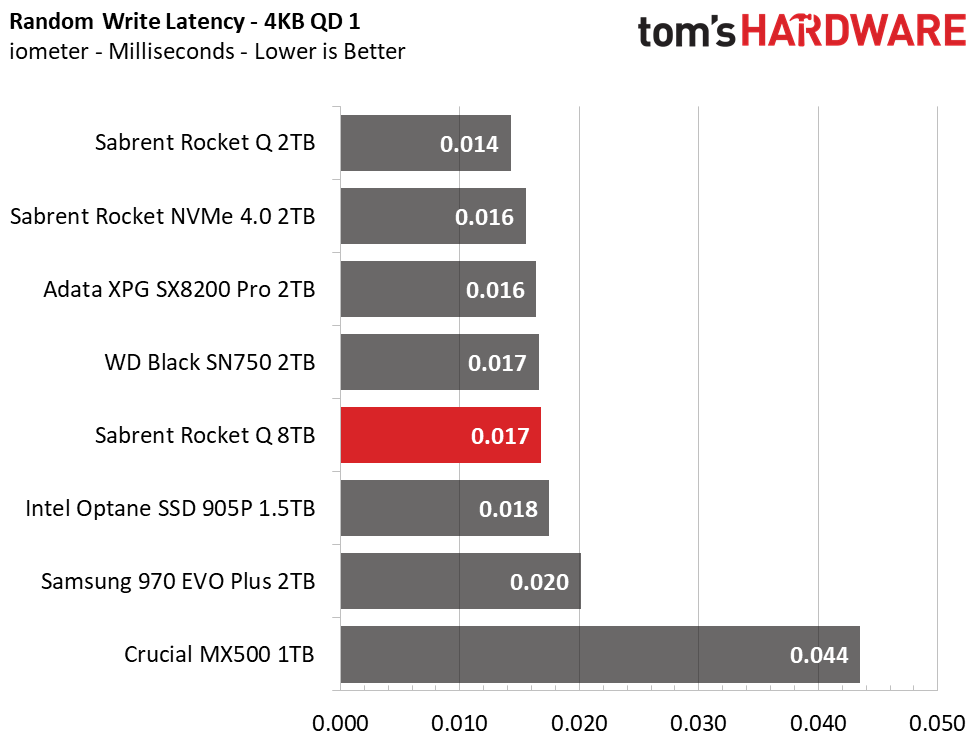
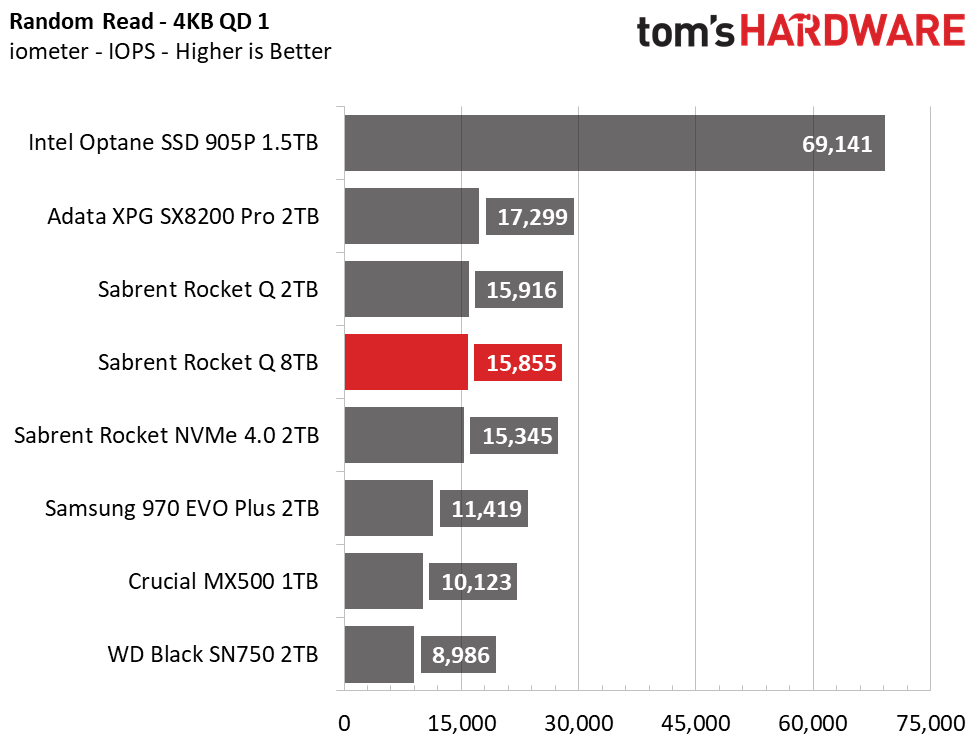
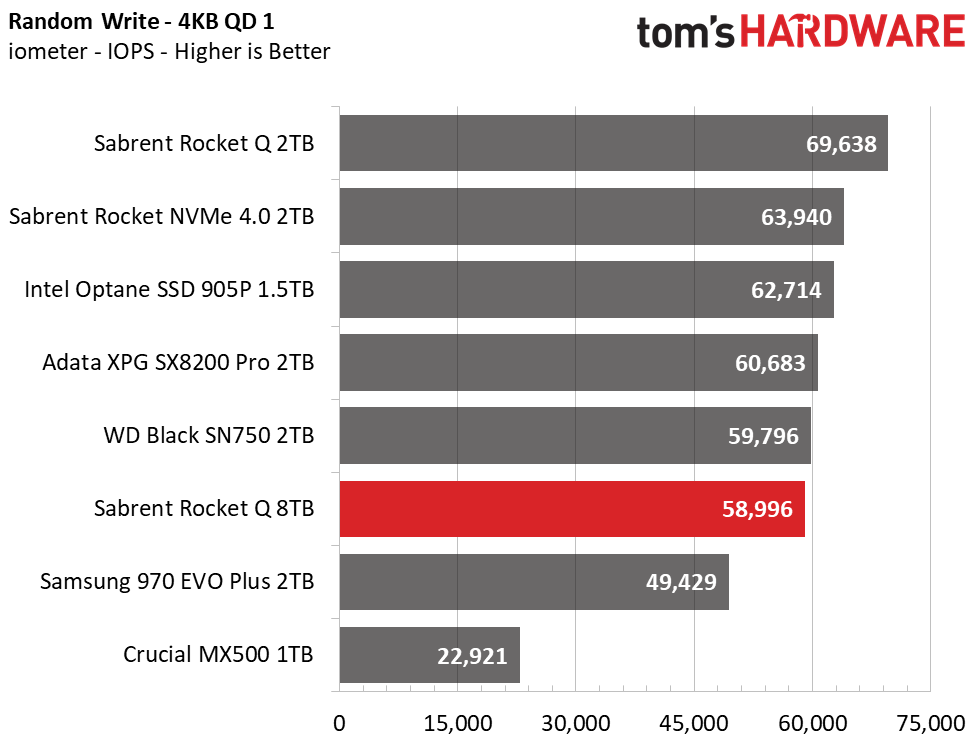
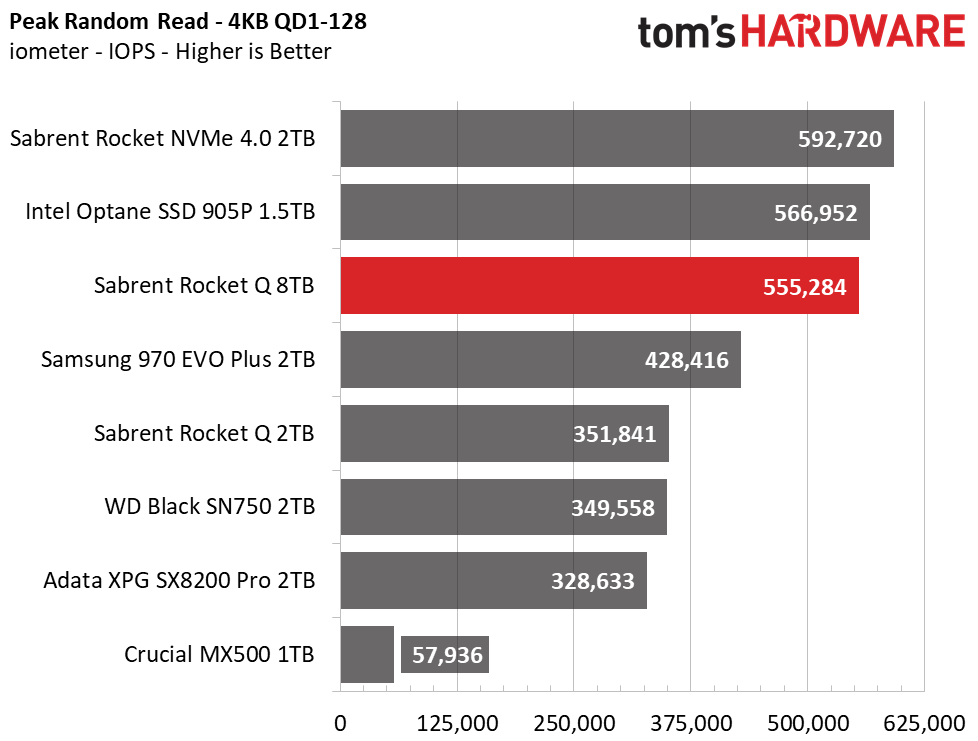
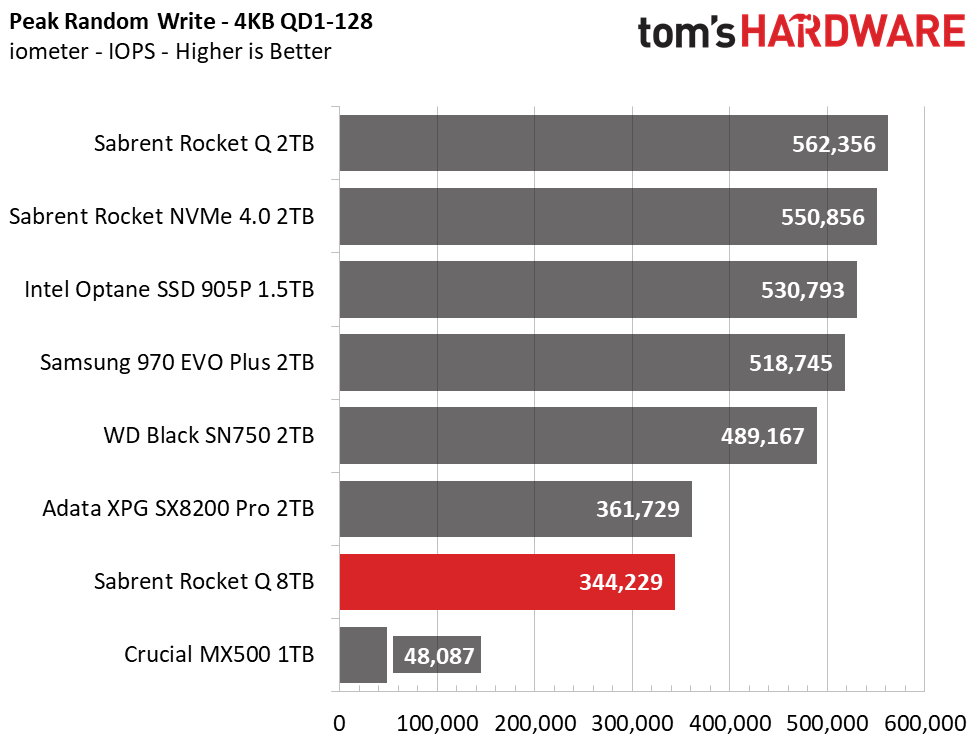
Under heavier loads, the Sabrent Rocket Q hit higher sequential speeds of roughly 3.5/3.0 GBps, placing it at a similar level as the WD Black SN750 and topping the Intel Optane SSD 905P. Micron’s NAND usually operates within a very tight latency profile, and here we see that tendency carry over to Sabrent’s 8TB Rocket Q. The drive’s random read performance ties with the 2TB model for third place, and its write responsiveness is faster than Intel’s Optane SSD 905P’s at a QD1. Additionally, we see that the 2TB model is tuned for higher random write performance while Sabrent tuned the 8TB model for higher random read performance and limited random write throughput under heavy load.
Sustained Write Performance and Cache Recovery
Official write specifications are only part of the performance picture. Most SSD makers implement a write cache, which is a fast area of (usually) pseudo-SLC programmed flash that absorbs incoming data. Sustained write speeds can suffer tremendously once the workload spills outside of the cache and into the "native" TLC or QLC flash. We use iometer to hammer the SSD with sequential writes for 15 minutes to measure both the size of the write cache and performance after the cache is saturated. We also monitor cache recovery via multiple idle rounds.
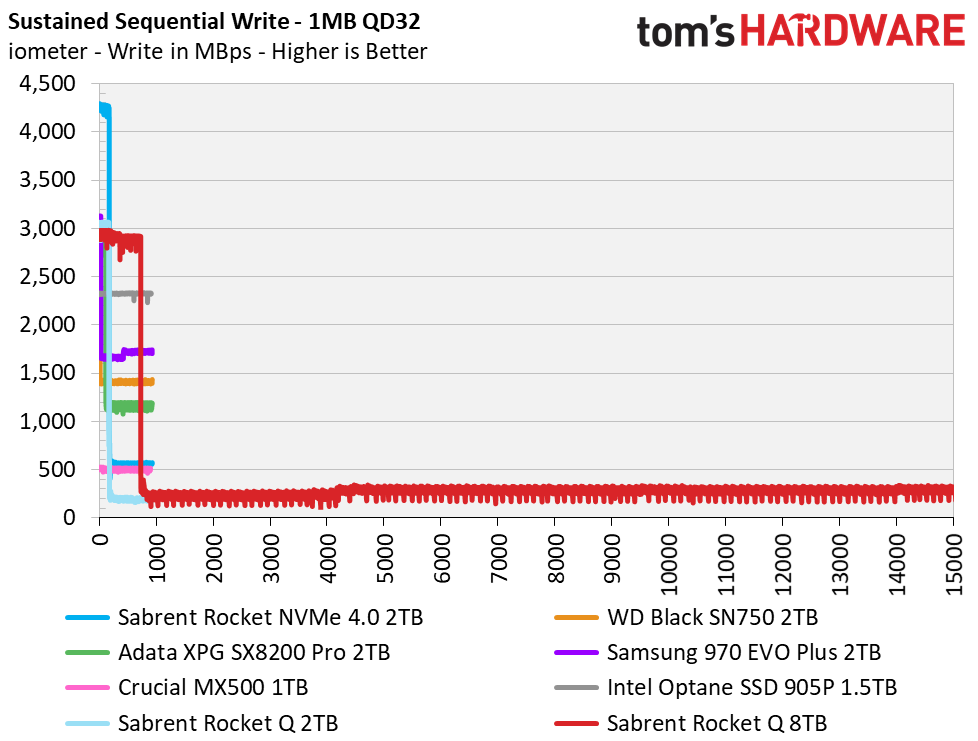

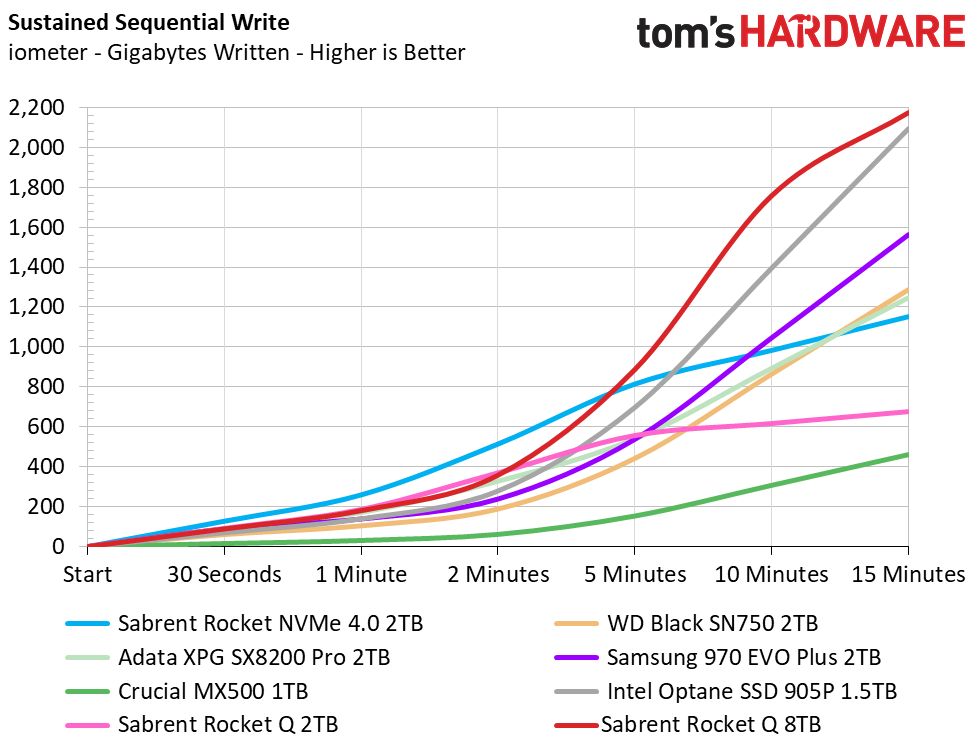
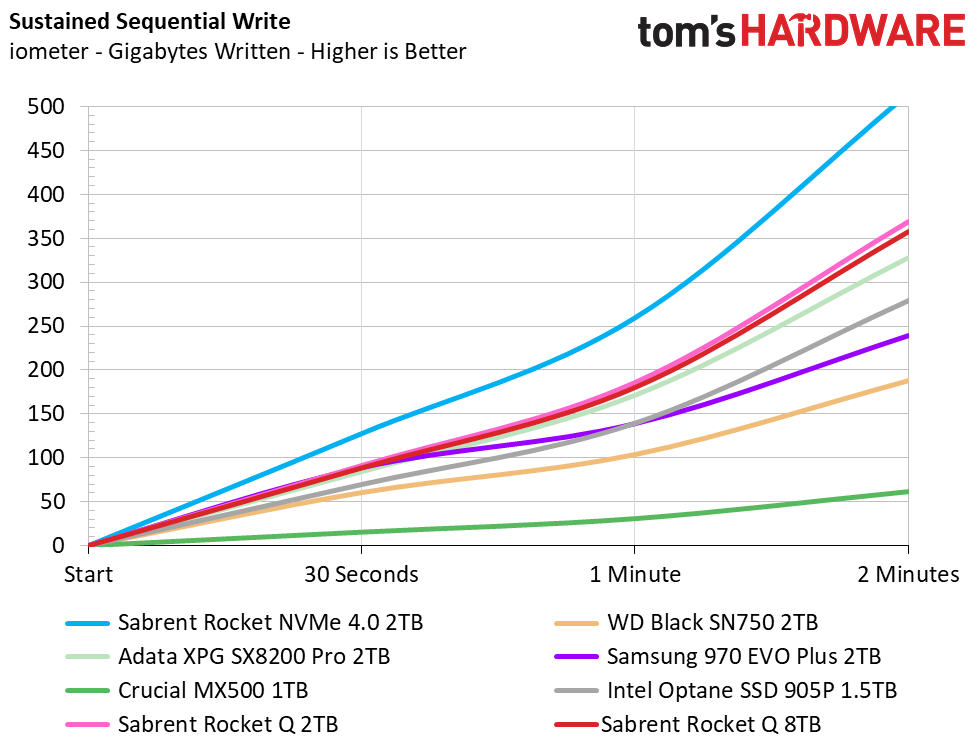
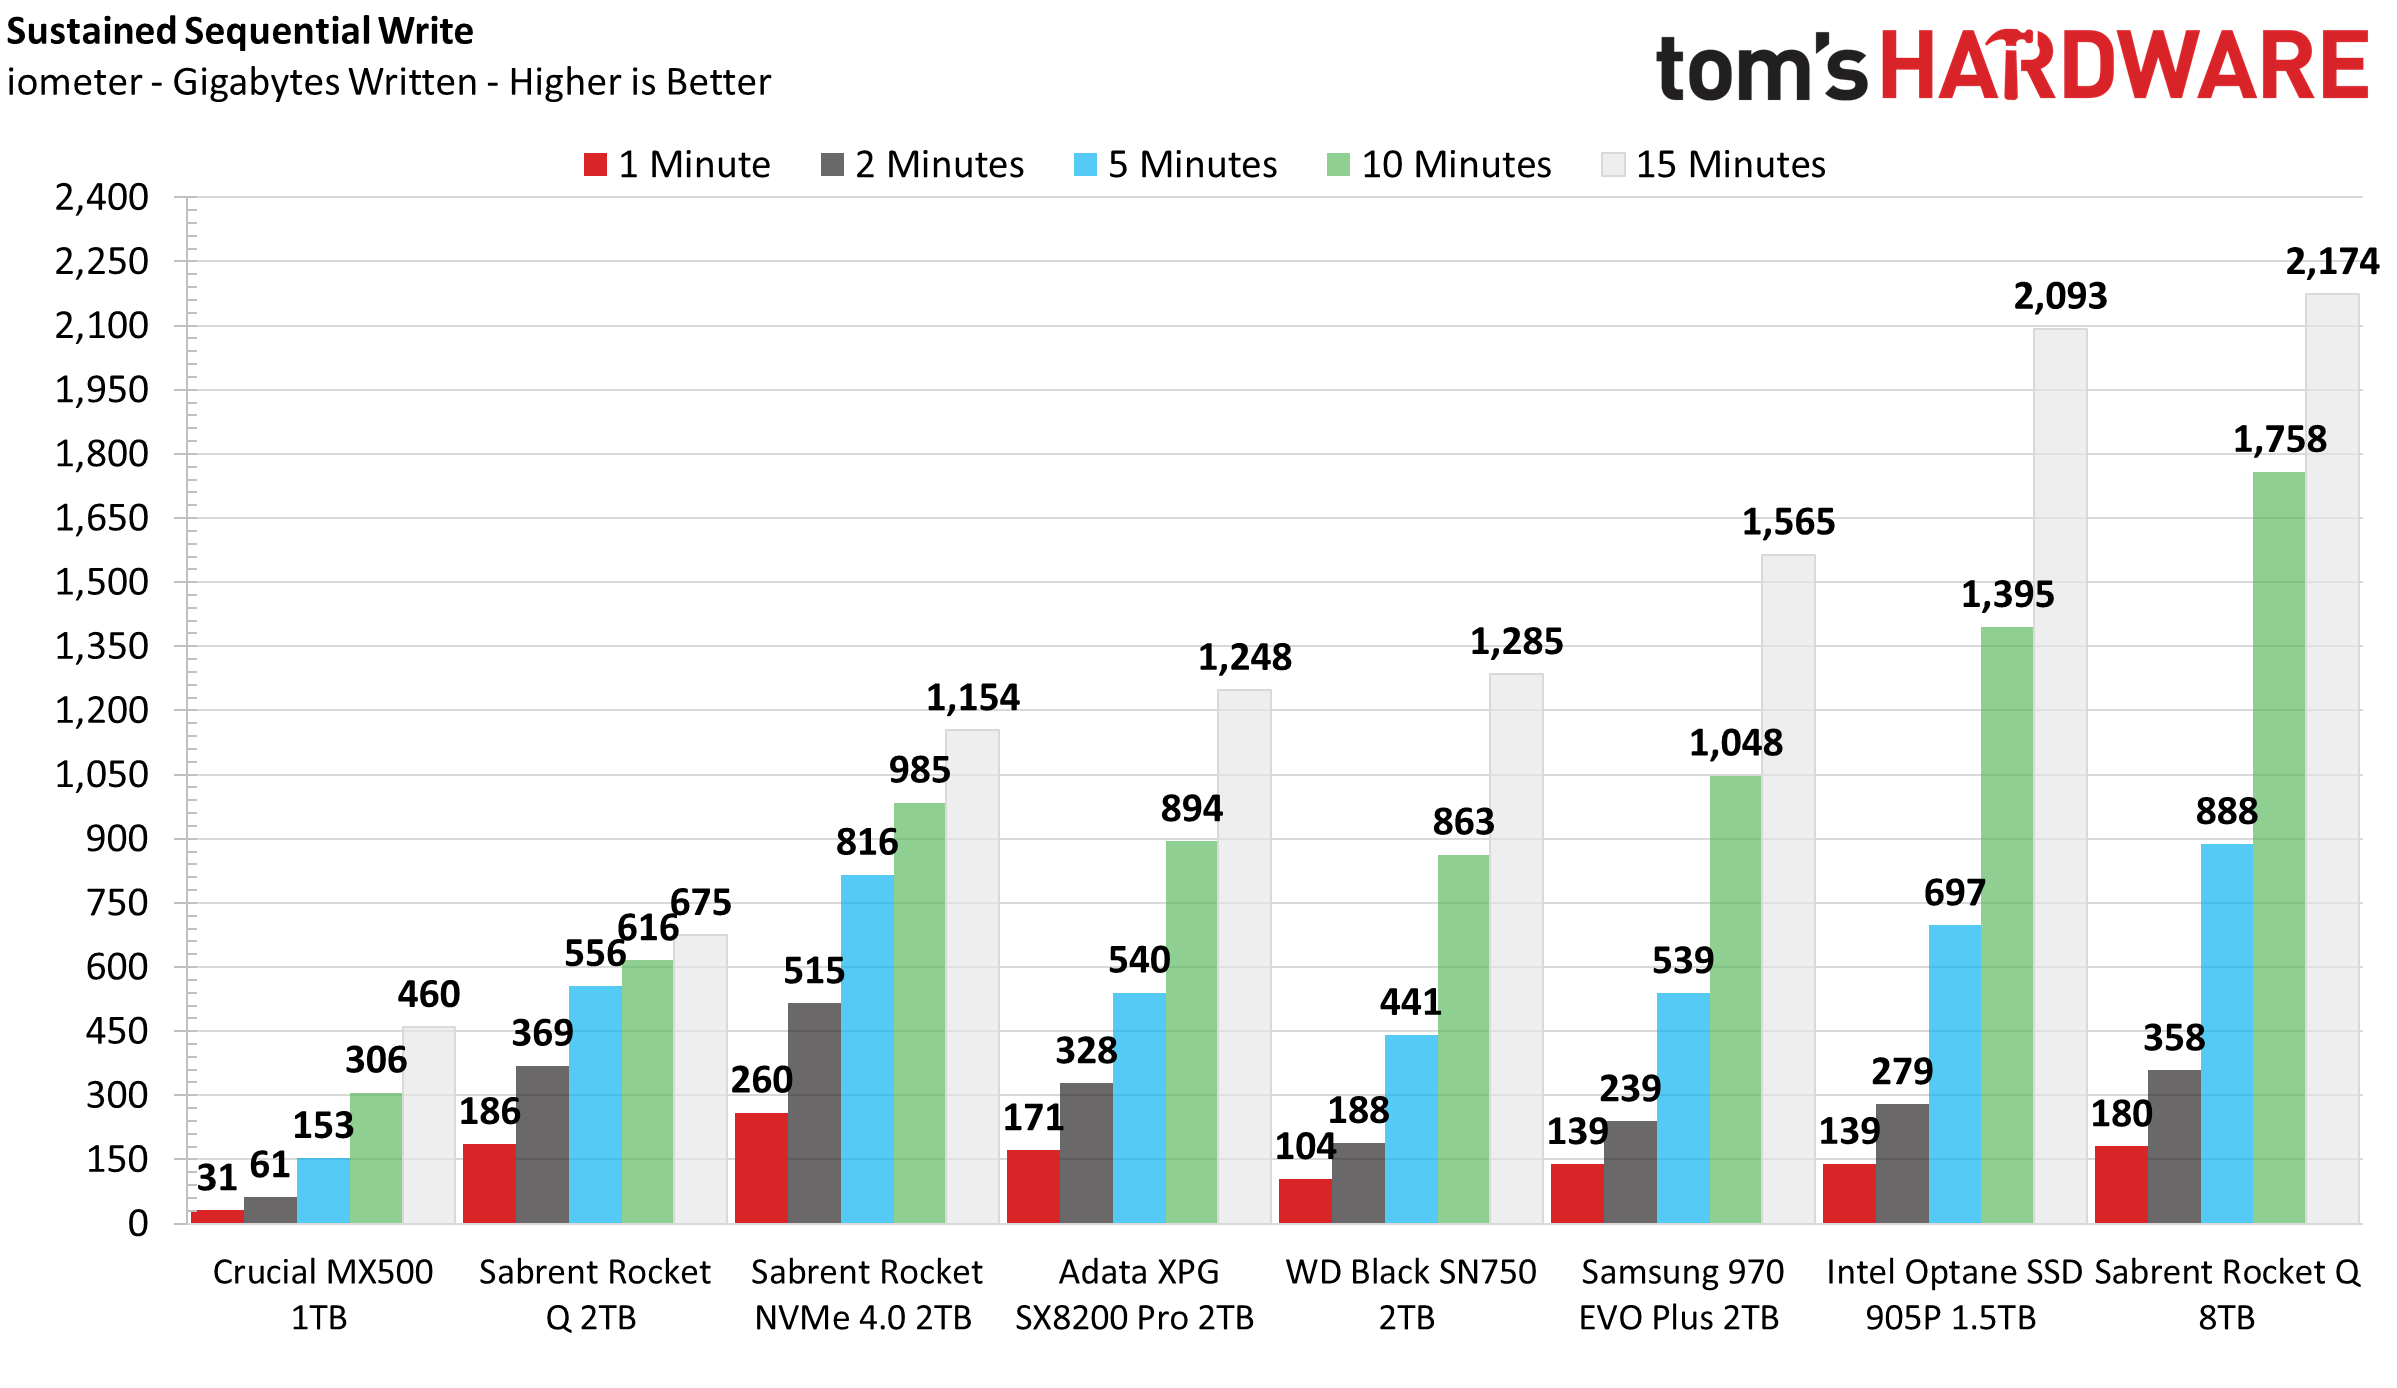
Sabrent’s Rocket Q features a massive dynamic SLC write cache that spans a quarter of the SSD’s available capacity. The 8TB Rocket Q wrote a little over 2.1TB of data at 2.9 GBps before degrading to an average speed of 276 MBps after the write cache filled. After four hours of writing, it wrote 6.1TB of data overall. This beats the 2TB model in worst-case write performance, and means you can get away with writing hundreds of GB of data at a time, over and over again, given you have enough free capacity. The write cache recovers fairly quickly, too. Give the SSD a few minutes of idle time, usually 2-5 minutes, and a lot of the write cache will recover.
Power Consumption and Temperature
We use the Quarch HD Programmable Power Module to gain a deeper understanding of power characteristics. Idle power consumption is an important aspect to consider, especially if you're looking for a laptop upgrade. Some SSDs can consume watts of power at idle while better-suited ones sip just milliwatts. Average workload power consumption and max consumption are two other aspects of power consumption, but performance-per-watt is more important. A drive might consume more power during any given workload, but accomplishing a task faster allows the drive to drop into an idle state faster, which ultimately saves power.
When possible, we also log the temperature of the drive via the S.M.A.R.T. data to see when (or if) thermal throttling kicks in and how it impacts performance. Bear in mind that results will vary based on the workload and ambient air temperature.
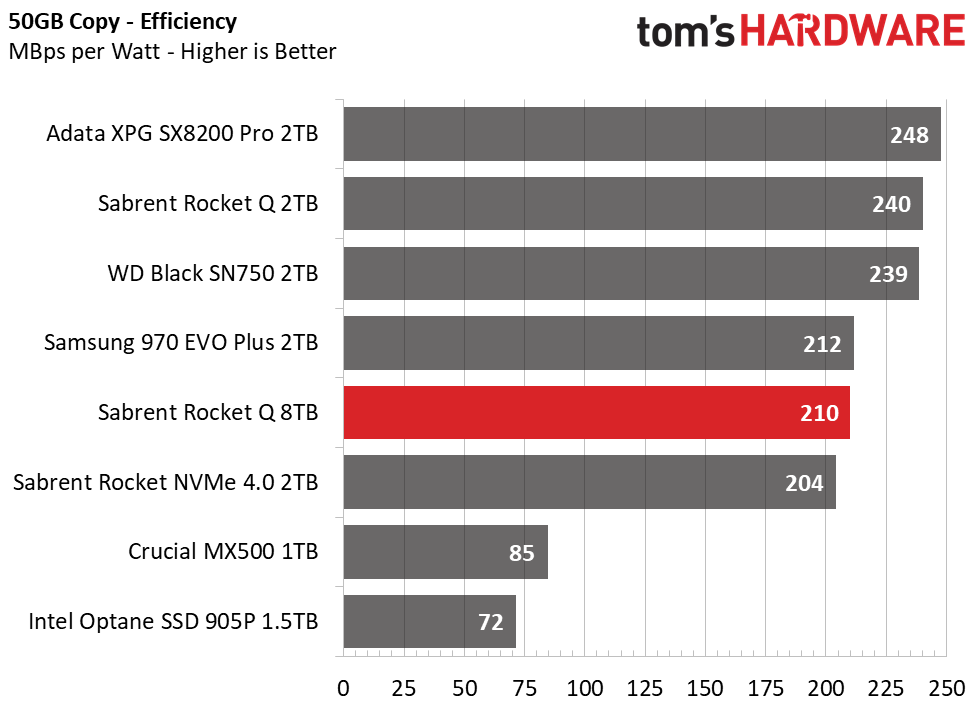
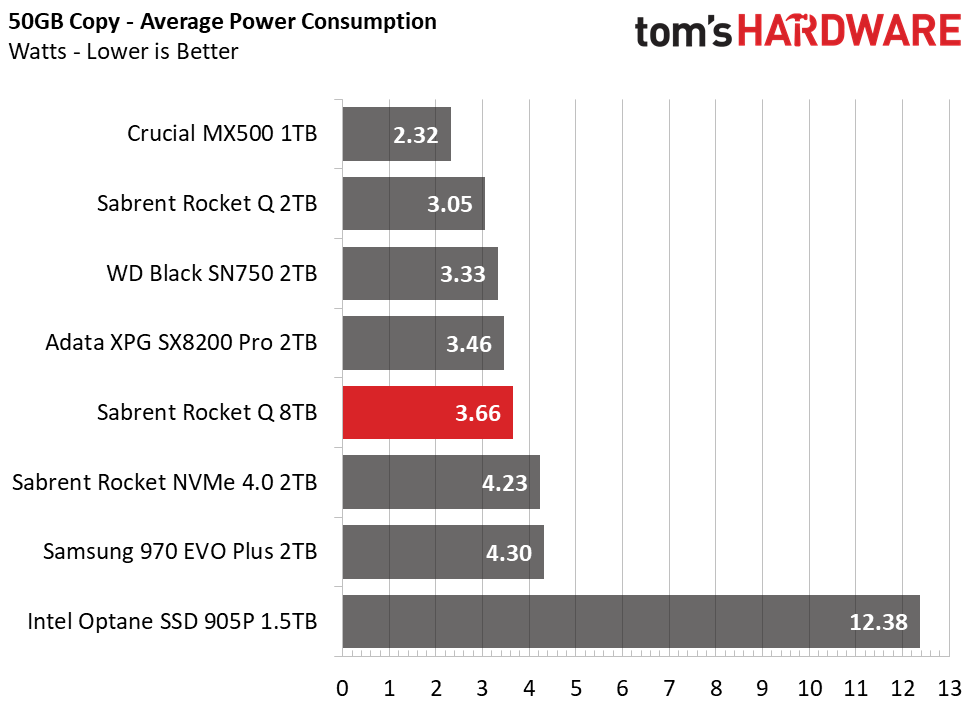
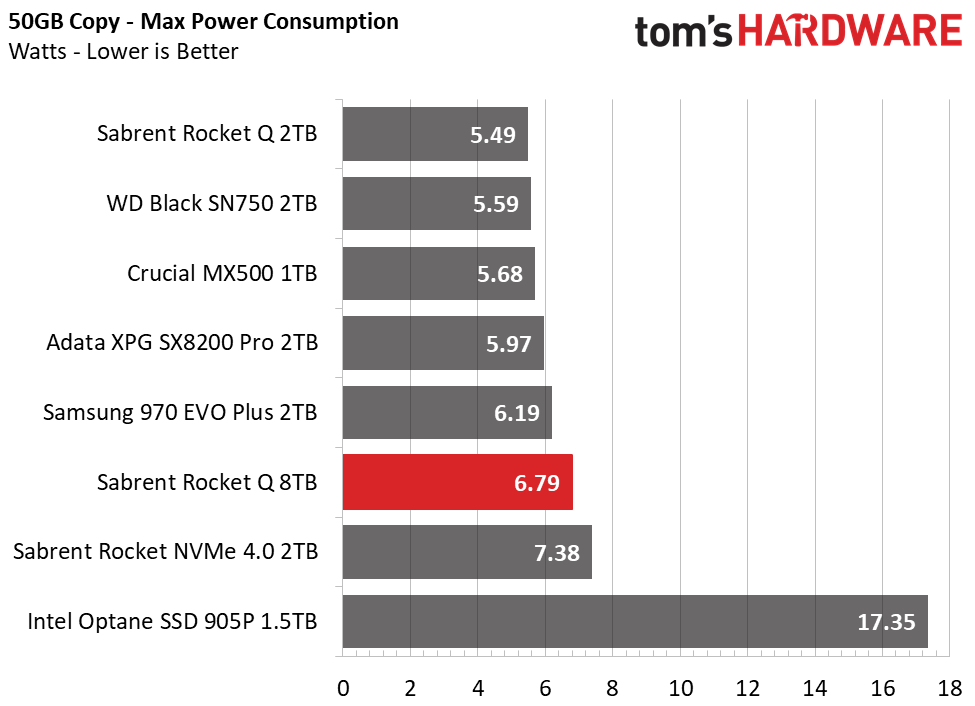
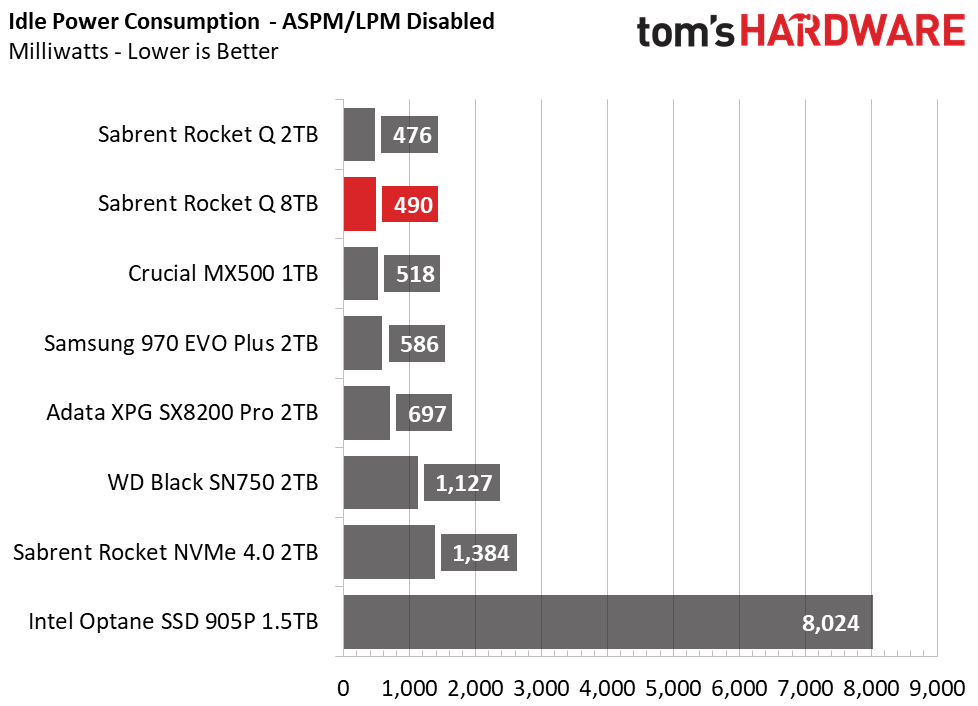
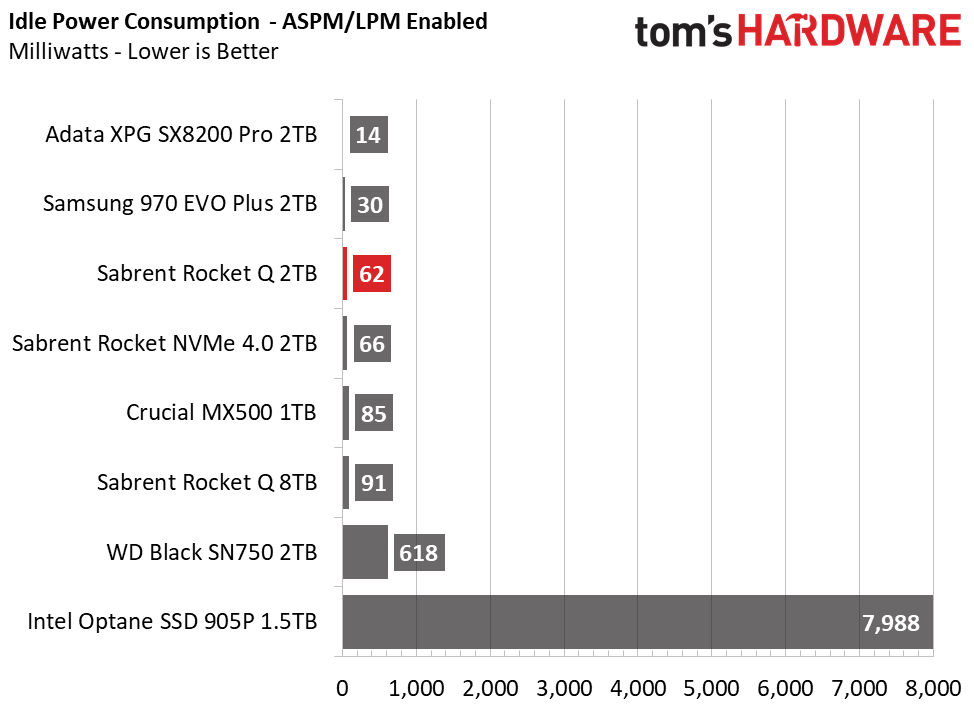
Sabrent’s Rocket Q is a fairly efficient NVMe SSD. Averaging 210 MBps-per-watt during our 50GB file transfer, the Rocket Q edges ahead of the faster Rocket NVMe 4.0 and leaves the Crucial MX500 looking just as bad as the Intel Optane 905P. Average power consumption is well regulated. Even with four times the density of competing drives, it consumes less power than Sabrent’s Rocket NVMe 4.0 and Samsung’s 970 EVO Plus. The drive shifts into lower power states at idle, too, consuming just mWs of power compared to the watts of power an HDD sucks down.
When it comes to heat output, the Phison E12S and 8TB of NAND can run toasty under load, but will usually be fine during light use with little to no airflow. However, we tested the SSD with 100-200GB file transfers without any airflow and the controller measured a peak temperature of 82.4 degrees Celsius (C). The SMART data read 71C, while the NAND measured 64C. Those temperatures triggered performance throttling. For the most consistent performance under prosumer-like use or large file transfers, it would be best to direct some airflow to the drive or place it under your motherboard’s M.2 heatsink.
MORE: Best SSDs
MORE: How We Test HDDs And SSDs
MORE: All SSD Content
Current page: 8TB Performance Results
Prev Page Features and Specifications Next Page 2TB Performance Results
Sean is a Contributing Editor at Tom’s Hardware US, covering storage hardware.
-
MartinBarcelona Good news, 1/4 of the drive being slc (to use as cache) is alot.. so best drive .. for such capacity..Reply
Sabrent’s Rocket Q features a massive dynamic SLC write cache that spans a quarter of the SSD’s available capacity. The 8TB Rocket Q wrote a little over 2.1TB of data at 2.9 GBps before degrading to an average speed of 276 MBps after the write cache filled. -
gio2vanni86 Saw linus put this thing through a test. Seems fast. And the storage is heading into the right direction. The only problem i see is the same one i saw back in 2010... $$$$. Thats a steep price to swallow.Reply -
geogan Considering how much disc recovery firms charge to attempt to recover data from failed normal SATA drives... I'd love to see how much they would charge to try and recover all 8TB of your data when this fails... if you have something like this you 100% also need to budget another couple hundred for a 10TB backup SATA drive.Reply
I have seen ridiculous prices from some of these recovery companies like charging 500 straight up then and more to pay for the clone drive plus something like $75 for each TB over 1TB to recover. I calculated the cost of restoring a bog standard 6TB WD drive at over $1000 which for a drive that cost me $150 second hand is just <Mod Edit> ridiculous. They are gougers, talking advantage of people being desperate to recover their precious recordings/pictures/data. Don't give them the chance. -
mik1 Tomshardware, I can't find any latency measurements per read operation out there! As in you give the SSD a 4K aligned read command, how many milliseconds will it take for it to respond.Reply
I believe it is ballpark 0.5 milliseconds which is the typical for most recent M.2 NVMe SSDs currently (and Optane leads with 0.01), can you please confirm? -
seanwebster Reply
Double check the iometer /synthetic testing section of the benchmark pages, it should be there.mik1 said:Tomshardware, I can't find any latency measurements per read operation out there! As in you give the SSD a 4K aligned read command, how many milliseconds will it take for it to respond.
I believe it is ballpark 0.5 milliseconds which is the typical for most recent M.2 NVMe SSDs currently (and Optane leads with 0.01), can you please confirm? -
mik1 @seanwebster I reviewed page 2 and 3 carefully now and there are now IO latency numbers there.Reply
If there would have been any screenshots of IOMeter, I presume they would have shown the latency, but none are published. -
seanwebster Reply
I don’t take screenshots of the iometer results, I log them and sort through the raw data to chart it instead.mik1 said:@seanwebster I reviewed page 2 and 3 carefully now and there are now IO latency numbers there.
If there would have been any screenshots of IOMeter, I presume they would have shown the latency, but none are published. -
mik1 @seanwebster i don't see any latency chart, did you provide one?Reply
(I only see the "tracing testing", maybe that depends on latency and so reflects it, i'd greatly appreciate an actual latency metric though) -
seanwebster Replymik1 said:@seanwebster i don't see any latency chart, did you provide one?
(I only see the "tracing testing", maybe that depends on latency and so reflects it, i'd greatly appreciate an actual latency metric though)
It isn't under trace testing, it is under "synthetic testing - iometer," as mentioned previously. You need to look through the gallery for the 4K random QD1 response latency. Sequential read is only the first image of the iometer gallery.
I've attached the 8TB results from the review.
