Intel Xeon E5-2600 V3 Review: Haswell-EP Redefines Fast
Benchmark Results
For our first set of benchmarks, we are going to look at the most common suites we ran, including UnixBench (both in single and multi-threaded modes), HardInfo, sysbench, and STREAM.
UnixBench 5.1.3
One way that Intel keeps thermals manageable on the more complex Haswell-EP-based CPUs is scaling back clock rate. For example, the Xeon E5-2699 v3 operates at just 2.3 GHz, which is 300 MHz less than the -2690 v3. Single-threaded performance is still highly relevant in server workloads though, which is why Turbo Boost technology exists. A great example of this is Minecraft, which went from an obscure title to a phenomenon. The game server was bottlenecked by single-threaded performance, compelling many admins to use Xeon E3s in a quest for higher frequencies.
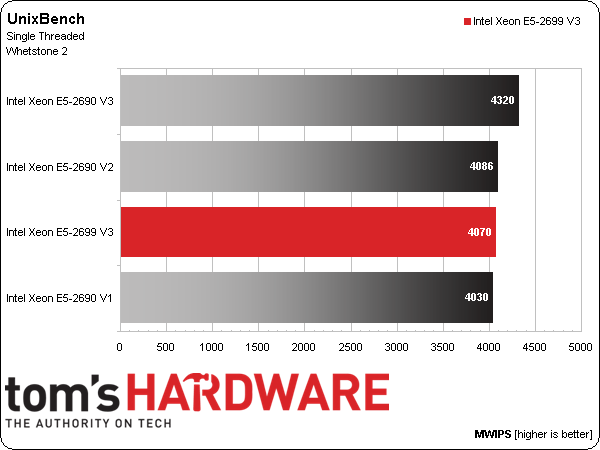
In our first UnixBench Whetstone/Dhrystone run, we ran the test in single-threaded mode.
Single-threaded Whetstone is relatively consistent between the three processors, despite a 700 MHz difference between the base clock rates of Intel's Xeon E5-2690 v2 and -2699 v3.
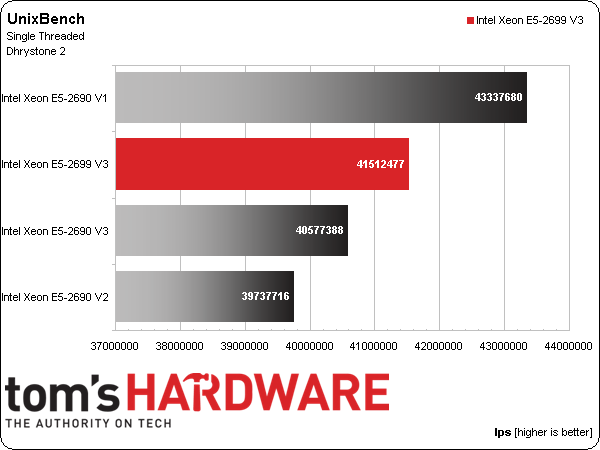
Single-threaded Dhrystone is a different story; the Xeon E5-2690 v1 pulls ahead by almost 10%. Despite the scaling of this chart, however, the results are really fairly close, even if we'd typically expect the architectural improvements rolled into Haswell to convey significant advantages over Sandy Bridge.
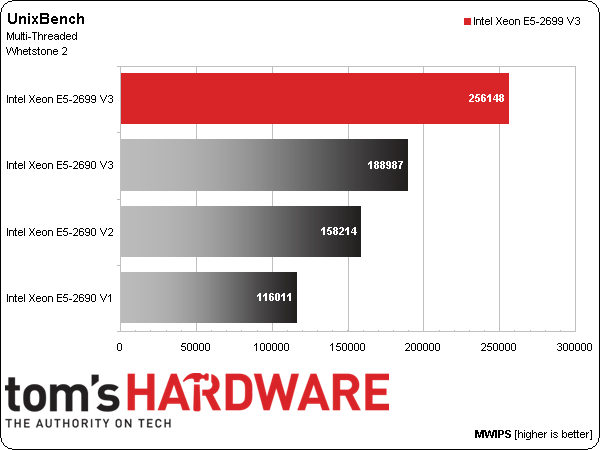
We can turn to the multi-threaded results to see more notable changes.
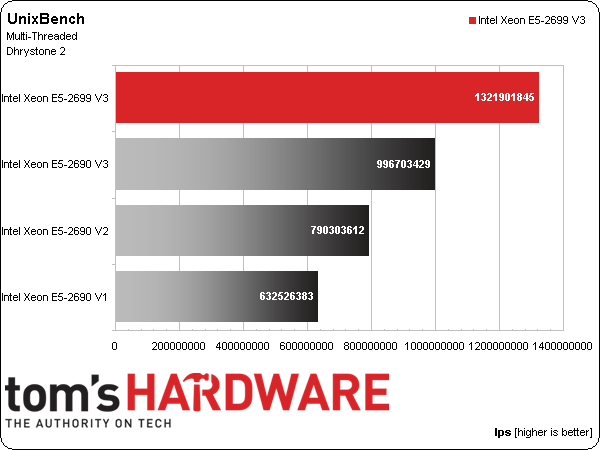
As we might expect, the threaded results illustrate that adding cores helps scale performance in workloads properly optimized for multi-core designs. The Xeon E5-2699 v3 puts up greater than 2x performance improvement versus the -2690 v1, which was top-of-the-line in its day.
Get Tom's Hardware's best news and in-depth reviews, straight to your inbox.
We clearly see the evolution of Intel's Xeon E5-2690 line-up from its first iteration to the v3 version. The other standout is the Xeon E5-2699 v3, which shows that 18 cores and 36 threads per processor deliver huge gains in a parallelized task, particularly compared to the once-fastest Xeon E5-2690.
HardInfo
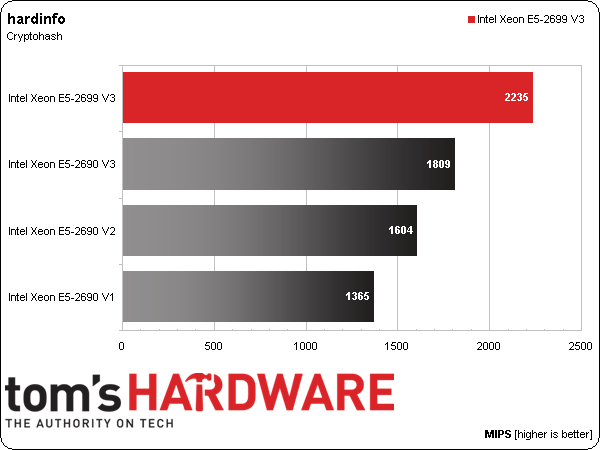
This is certainly less dramatic than our Whetstone and Dhrystone results, but there is still solid scaling.
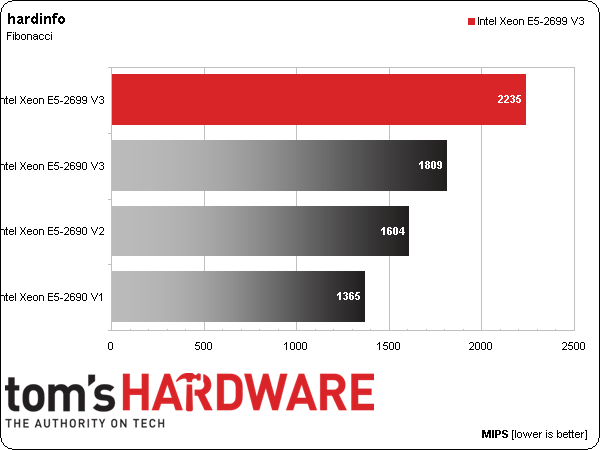
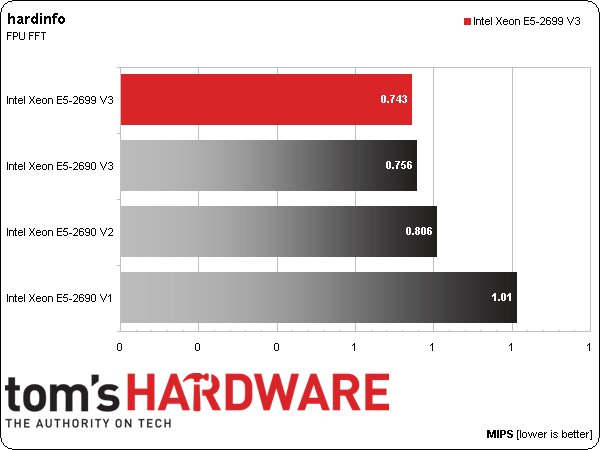
Our next tests are the Fibonacci sequence calculation and FPU FFT module.
Higher core counts again benefit the v3 processors.
In all three metrics, we see linear improvements from one generation to the next, as the Xeon E5-2699 v3 pulls ahead. Intel's original Xeon E5-2690 was a 2.9 GHz part, and the -2690 v2 stepped up to 3 GHz, so the fact that lower-frequency v3s maintain a lead is telling.
Sysbench CPU
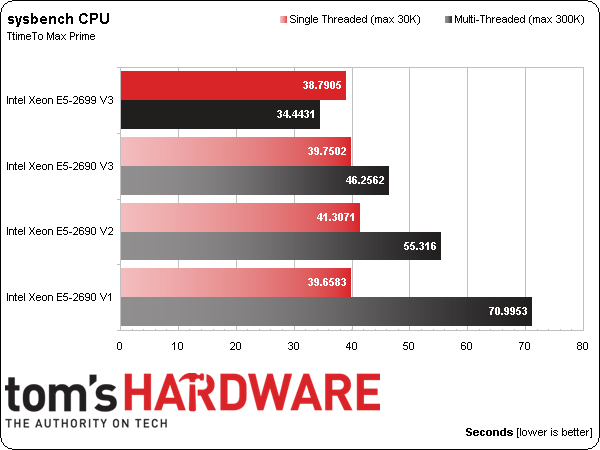
Searching for prime numbers is a math problem that can be parallelized easily. As a result, it scales well with additional cores.
The Haswell-EP parts are on par with Sandy Bridge-EP and Ivy Bridge-EP when it comes to single-threaded performance. Of course, we know from the growing core counts that Intel is putting its emphasis on extra execution resources, rather than burning TDP on peak clock rates. So, maintaining the status quo there was likely deemed acceptable. But load down all available cores and it's easy to see where Haswell-EP has its greatest impact.
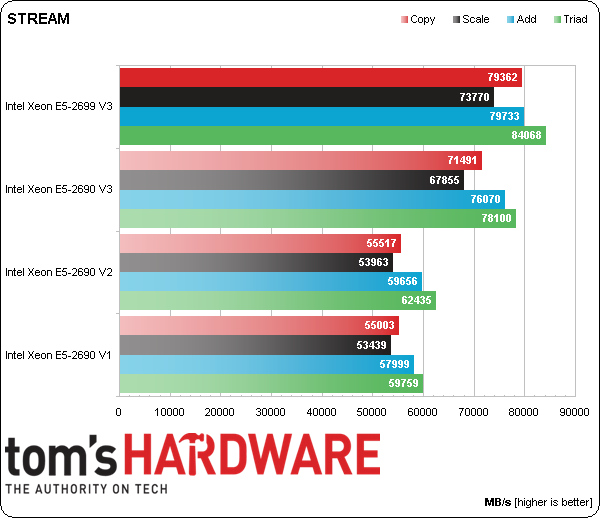
STREAM
We did make one adjustment to the test configurations before running these tests. After noticing our control server with the Xeon E5-2699 and Supermicro-sourced boxes were scoring similarly, we decided to create a little side experiment, giving the -2699 v3 four 16 GB DDR4 DIMMS per processor. The Xeon E5-2690 v3 received eight 8 GB RDIMMs per processor to match the first-gen and v2 platforms.
The results show both the impacts of adding more memory and the nice scaling we get moving from 1600 MT/s DDR3L to 2133 MT/s DDR4. There is clearly a performance benefit attributable to the new standard; it's not just about power consumption.
Current page: Benchmark Results
Prev Page Linux-Bench Components And Test Setup Next Page More Benchmark Results-
CaptainTom Wonder how long it is until 18-core CPU's are utilized well in games...Maybe 2018 or 2020?Reply -
dovah-chan ReplyCaptain Tom said:Wonder how long it is until 18-core CPU's are utilized well in games...Maybe 2018 or 2020?
Actually we should be trying to move away from traditional serial-styled processing and move towards parallel processing. Each core can handle only one task at a time and only utilize it's own resources by itself.
This is unlike a GPU, where many processors utilize the same resources and perform multiple tasks at the same time. The problem is that this type of architecture is not supported at all in CPUs and Nvidia is looking for people to learn to program for parallel styled architectures.
But this lineup of CPUs is clearly a marvel of engineering and hard work. Glad to see the server industry will truly start to benefit from the low power and finely-tuned abilities of haswell along with the recently introduced DDR4 which is optimized for low power usage as well. This, combined along with flash-based storage (aka SSDs) which also have lower power drain than the average HDD, will slash through server power bills and save companies literally billions of dollars. Technology is amazing isn't it? -
2Be_or_Not2Be There is still a lot in games that doesn't translate well into parallel processing. A lot of gaming action only happens as a direct result of the user's input, and it usually triggers items that are dependent upon the results from another item. So parallel processing doesn't help a lot there; single-threaded performance helps more.Reply
However, with multiple cores, now we can have better AI and other "off-screen" items that don't necessarily always depend upon the user's direct input. There's still a lot of work to be done there, though. -
2Be_or_Not2Be The new Haswell-EP Xeons are definitely going to help with virtualization. However, I see the high-price of DDR4 and the relative scarcity of it now as being a bit of a handicap to fast adoption, especially since that is one of the major limiting factors to how many servers you can virtualize.Reply
I think all of the major server vendors are going to suck up all of the major memory manufacturers DDR4 capacity for a while before the prices go down. -
balister ReplyThe new Haswell-EP Xeons are definitely going to help with virtualization. However, I see the high-price of DDR4 and the relative scarcity of it now as being a bit of a handicap to fast adoption, especially since that is one of the major limiting factors to how many servers you can virtualize.
I think all of the major server vendors are going to suck up all of the major memory manufacturers DDR4 capacity for a while before the prices go down.
Whether it helps or hinders will ultimately depend on the VM admin. What most VM admins don't realize is that HT can actually end up degrading performance in virtual environments unless the VM admin took specific steps to use HT properly (and most do not). A lot of companies will tell you to turn off HT to increase performance because they've dealt with a lot of VM admins that don't set things up properly (a lot of VM admins over allocate which is part of the reason using HT can degrade performance, but there are other settings as well that have to be set in the Hypervisor so that the guest VMs get the resources they need). -
InvalidError Reply
This is easier said than done since there are tons of everyday algorithms, such as text/code parsing, that are fundamentally incompatible with threading. If you want to build a list or tree using threads, you usually need to split the operation to let each thread work in isolated parts of the list/tree so they do not trip over each other and waste most of their time waiting on mutexes and at the end of the build process, you have a merge process to bring everything back together which is usually not very thread-friendly if you want it to be efficient.14133592 said:Actually we should be trying to move away from traditional serial-styled processing and move towards parallel processing. Each core can handle only one task at a time and only utilize it's own resources by itself.
In many cases, trying to convert algorithms to threads is simply more trouble than it is worth. -
Rob Burns Great to see these processors out, and overall good article. I only wish you used the same benchmark suite you had for the Haswell-E processors: 3DS Max, Adobe Premiere, After Effects, Photoshop. I'd also love to see Vray added to the mix. Not much useful benchmark data in here for 3D professionals. Some good detail on the processors themselves however.Reply -
Drejeck ReplyWonder how long it is until 18-core CPU's are utilized well in games...Maybe 2018 or 2020?
Simply never.
A game is made by sound, logic and graphics. You may dedicate this 3 processes to a number of cores but they remain 3. As you split load some of the logic must recall who did what and where. Logic deals mainly with FPU units, while graphics with integers. GPUs are great integers number crunchers. They have to be fed by the CPU so an extra core manage data through different memories, this is where we start failing. Keeping all in one spot, with the same resources reduces need to transfer data. By implementing a whole processor with GPU, FPU, x86 and sound processor all in one package with on board memory makes for the ultimate gaming processor. As long as we render scenes with triangles we will keep using the legacy stuff. When the time will come to render scenes by pixel we will need a fraction of today's performance, and half of the texture memory (just scale the highest quality) and half of models memory. Epic is already working on that.
-
pjkenned ReplyGreat to see these processors out, and overall good article. I only wish you used the same benchmark suite you had for the Haswell-E processors: 3DS Max, Adobe Premiere, After Effects, Photoshop. I'd also love to see Vray added to the mix. Not much useful benchmark data in here for 3D professionals. Some good detail on the processors themselves however.
Great points. One minor complication is that the NVIDIA GeForce Titan used in the Haswell-E review would not have fit in the 1U servers (let alone be cooled well by then.) Onboard Matrox G200eW graphics are too much of a bottleneck for the standard test suite.
On the other hand, this platform is going to be used primarily in servers. Although there are some really nice workstation options coming, we did not have access in time for testing.
One plus is that you can run the tests directly on your own machine by booting to a Ubuntu 14.04 LTS LiveCD, and issuing three commands. There is a video and the three simple commands here: http://linux-bench.com/howto.html That should give you a rough idea in terms of performance of your system compared to the test systems.
Hopefully we will get some workstation appropriate platforms in the near future where we can run the standard set of TH tests. Thanks for your feedback since it is certainly on the radar.
