System Builder Marathon, June 2011: $2000 Performance PC
Value Conclusion
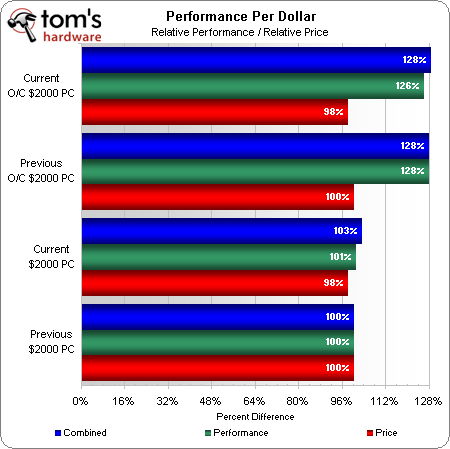
Our new build did not overclock as well as our previous machine, but it did cost slightly less. Could that make it the better overall value?
A 2% performance difference is offset by a 2% price difference in our overclocked configurations, and keen eyes will note that the current build’s 128% bar is two pixels wider than that of the previous build, indicating an advantage of less than 1%.
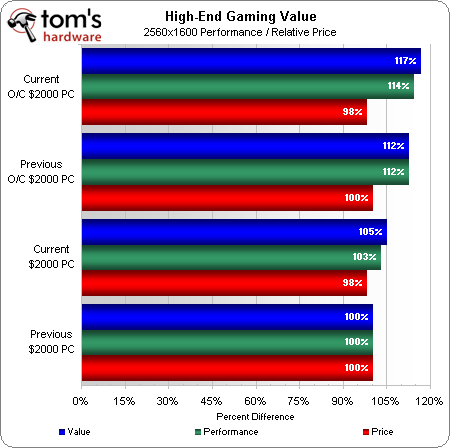
Gaming accounted for 30% of our overall performance score however, and we don’t think anyone buys these cards to game at low resolutions. Thus, a closer look at our highest test resolution might also prove informative.
Our 2560x1600 gaming value chart provides some vindication from a pure performance standpoint, without even looking into where the new system could have shined: Quick Sync. Though this new technology was not used by any of today’s benchmarks, we’ve been happy enough with it in other venues that we really wanted to include the capability in this machine.
Non-benchmarked improvements, such as room for an extra graphics card, would have easily put the new machine over-the-top, but we think the lower price and classy chassis will be enough to convince many buyers that our new build is their better choice.
Get Tom's Hardware's best news and in-depth reviews, straight to your inbox.
-
regenon I gess u wanted to say:Reply
A pair of Radeon HD 6950s beats a pair of GeForce GTX 570s at our 2560x1600 target resolution, and the HD 6970 is even faster. -
Tamz_msc Finally you made a decent choice regarding the case. I could not believe you went with the Antec 300s on previous builds of this category.Reply -
buzznut I agree, though some may care less for what's on the outside I can't see putting together a $2000 PC with a 50 dolla case.Reply -
Yes, I am pleased to see a classy looking Lian Li case being used and not one of those gargoyle-inspired transformer-looking abominations that appeal only to google-eyed children and pimply-faced teenagers. That an adult might actually purchase that sort of monstrosity damped my hope for the future of the supposedly mature population of this world!Reply
-
hmp_goose So it's now considered "safe" to RAID 0 SSDs? I thought Tom's once had a big "here be dragons" label for that practice …Reply -
compton I too like the upgrade to a Lian Li. I didn't have a problem with the SBM method of fitting into a tightly constrained budget - but it's still good to see an attractive system as well as impressive performance. If someone is building a $2000 system, they can pony up a couple extra bucks for a better case. The System Builder Marathon is one of the best things going.Reply -
dragonsqrrl Again, another great high-end build (very similar to previous build), and my only real complaint (albeit a small one) from the last $2000 system was also addressed, the case.Reply
Are you guys satisfied with your decision to go with a higher-end case? Have you noticed any tangible benefits? For example, lower system temps, better build quality, better cable management, more interior room to work, additional features, etc...? -
whysobluepandabear Todd SauveYes, I am pleased to see a classy looking Lian Li case being used and not one of those gargoyle-inspired transformer-looking abominations that appeal only to google-eyed children and pimply-faced teenagers. That an adult might actually purchase that sort of monstrosity damped my hope for the future of the supposedly mature population of this world!Reply
You give vivid details describing children and teenagers, but might I add something for the adults? Something like: "That a wrinkly, weaker and deteriorating adult might actually purchase". Something along those lines - we must make those adults look like old fuddy-duddies, whom are at the brink of a midlife crisis any moment now!


