Why you can trust Tom's Hardware
Comparison Products
We threw the Seagate FireCuda 510 into the ring with some of the Best SSDs out. We include Seagate’s FireCuda 520 with its PCIe Gen4 interface as well as the PCIe Gen3 Adata XPG SX8200 Pro, Samsung 970 EVO Plus, and WD Black SN750. We also threw in some value options like the WD Blue SN550, Crucial MX500, and an HDD for good measure.
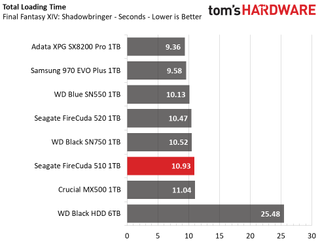
Game Scene Loading - Final Fantasy XIV
Final Fantasy XIV Stormbringer free real-world game benchmark that easily and accurately compares game load times without the inaccuracy of using a stopwatch.

Just as expected, the FireCuda 510 dishes out fast game load times, absolutely destroying the HDD, but it isn’t quite as responsive as some of its competition. With a 1 second lead over the FireCuda 510 and even the FireCuda 520, both Adata and Samsung offer up the fastest game load performance around.
Transfer Rates – DiskBench
We use the DiskBench storage benchmarking tool to test file transfer performance with our own custom blocks of data. Our 50GB data set includes 31,227 files of various types, like pictures, PDFs, and videos. Our 100GB includes 22,579 files with 50GB of them being large movies. We copy the data sets to new folders and then follow-up with a reading test of a newly written 6.5GB zip file and 15GB movie file.


Seagate’s FireCuda 510’s smaller dynamic SLC cache hurts it in our 50GB and 10GB file transfer tests. In both instances, the FireCuda 510 lagged the much cheaper WD Blue SN550 and couldn’t touch the performance of the other high-end competitors. When reading back our large test files, however, the FireCuda 510 matched or even outperformed them.
Trace Testing – PCMark 10 Storage Tests
PCMark 10 is a trace-based benchmark that uses a wide-ranging set of real-world traces from popular applications and common tasks to measure the performance of storage devices. The quick benchmark is more relatable to those who use their PCs for leisure or basic office work, while the full benchmark relates more to power users.


Seagate's FireCuda 510 and 520 both deliver among the fastest performance scores on the Quick System Drive benchmark. In light workloads, the FireCuda 510 is just as responsive as the Adata XPG SX8200 Pro; however, the small dynamic SLC cache seems to hold it back once we hit the SSD with the heavier Full System Drive benchmark. Seagate's FireCuda 510 fell from second place down to fifth place, but still managed to keep up with the Samsung SSD and surpasses WD's Black SN750.
Trace Testing – SPECworkstation 3
Like PCMark 10, SPECworkstation 3 is a trace-based benchmark, but it is designed to push the system harder by measuring workstation performance in professional applications.


Wth a higher bandwidth Gen4 link as well as a faster clock rate (733MHz), Seagate’s FireCuda 520 is top dog during the onslaught of prosumer workloads in SPECworkstation 3, but the FireCuda 510 isn’t too far behind. Thanks to its DRAM-based design, the Seagate FireCuda 510 pulled ahead of WD’s DRAMless Blue SN550, but not by much. Overall, it is only a minute to a minute and a half faster than both the WD Blue and Black. The competing Samsung 970 EVO Plus and Adata XPG SX8200 Pro have quite an advantage in these demanding workloads. With more responsive designs boasting larger SLC write caches, their performance is better than the Seagate FireCuda 510.
Synthetic Testing - ATTO / iometer
iometer is an advanced and highly configurable storage benchmarking tool while ATTO is a simple and free application that SSD vendors commonly use to assign sequential performance specifications to their products. Both of these tools give us insight into how the device handles different file sizes.


We tested Seagate's FireCuda 510 at a QD of 1 to represent most day-to-day file accesses at various block sizes. Overall results are impressive and in line with most of the top-end competition. Sequential performance ramped up nicely with increased block sizes. In iometer, sequential performance peaked at 3.476 MBps read and 3,060 MBps write, landing in fourth place overall. Again, both the Adata and Samsung show a distinct advantage with their more robust designs. Seagate's random read performance is just a hair faster than the Samsung 970 EVO Plus, and random write speeds are the second-fastest result on the chart. In terms of peak random performance, the FireCuda 501 can sustain up to 42,000/537,000 read/write IOPS, beaten only by the faster FireCuda 520 in high-QD multi-threaded workloads.
Sustained Write Performance and Cache Recovery
Official write specifications are only part of the performance picture. Most SSD makers implement a write cache, which is a fast area of (usually) pseudo-SLC programmed flash that absorbs incoming data. Sustained write speeds can suffer tremendously once the workload spills outside of the cache and into the "native" TLC or QLC flash. We use iometer to hammer the SSD with sequential writes for 15 minutes to measure both the size of the write cache and performance after the cache is saturated. We also monitor cache recovery via multiple idle rounds.


Seagate’s FireCuda 510 wrote at 3 GBps for the first 28GB before it degraded to 1,075 MBps for the remainder of the run. During idle periods, the SLC cache recovered at a rate of about 16GB per 30 seconds. So, after just a minute, the SSD can clear the cache and be fully ready to absorb more inbound write workloads.
While the smaller SLC cache hurts the FireCuda 510 in some tests, it offers an advantage when writing a lot to the SSD during events like cloning or image restoration. Once the cache is saturated, the FireCuda 510 offers very consistent write performance. The Adata XPG degrades to a slower 650 MBps write speed once it starts folding data back from the cache, but the FireCuda 510’s write performance remains above 1 GBps until it is full. However, Samsung’s 970 EVO Plus wipes the floor with them and even surpasses the WD Black SN750 by sustaining writes at a rate of 1.7 GBps after its hybrid cache is saturated.
Power Consumption and Temperature
We use the Quarch HD Programmable Power Module to gain a deeper understanding of power characteristics. Idle power consumption is an important aspect to consider, especially if you're looking for a laptop upgrade. Some SSDs can consume watts of power at idle while better-suited ones sip just milliwatts. Average workload power consumption and max consumption are two other aspects of power consumption, but performance-per-watt is more important. A drive might consume more power during any given workload, but accomplishing a task faster allows the drive to drop into an idle state faster, which ultimately saves power.
When possible, we also log the temperature of the drive via the S.M.A.R.T. data to see when (or if) thermal throttling kicks in and how it impacts performance. Bear in mind that results will vary based on the workload and ambient air temperature.


While average power consumption is very low at just 3.3 W and peaks at just a little over 5W,
Seagate’s FireCuda fell behind the pack in file copy efficiency as it landed in sixth place. At idle, the drive is still fairly efficient. When ASPM is disabled, it consumes about the same amount of power as the Samsung 970 EVO Plus, and when enabled, it consumes even less (just 52mW with the capacity at 50% full). Additionally, temps shouldn’t be of much concern when using the FireCuda 510. We weren’t able to trigger its thermal throttle limits when hammering the SSD with a few 100GB read/write workloads.
MORE: Best SSDs
MORE: How We Test HDDs And SSDs
MORE: All SSD Content

Sean is a Contributing Editor at Tom’s Hardware US, covering storage hardware.
-
CatalyticDragon The color of the PCB counts against it but the fact that it's only PCIe3 doesn't? Weird.Reply -
seanwebster Reply
I don't see how that would count against it. Next-gen controllers haven't dropped yet. Most of the market is Gen3 based. Intel doesn't even support the Gen4 interface yet, either.CatalyticDragon said:The color of the PCB counts against it but the fact that it's only PCIe3 doesn't? Weird. -
evil_72 Reply
The lowliest of current generation of Ryzen 3k chips do though, such as the Ryzen 3300X @ $120.00 USD, which supports Gen 4 on the B550 motherboards, starting @ $89.00.seanwebster said:I don't see how that would count against it. Next-gen controllers haven't dropped yet. Most of the market is Gen3 based. Intel doesn't even support the Gen4 interface yet, either. -
seanwebster Reply
Yep, but if someone is buying low-end hardware, to begin with, they aren't going to splurge for Gen4 SSDs that cost a premium for very little advantage.evil_72 said:The lowliest of current generation of Ryzen 3k chips do though, such as the Ryzen 3300X @ $120.00 USD, which supports Gen 4 on the B550 motherboards, starting @ $89.00.
