Meet The 2012 Graphics Charts: How We're Testing This Year
It's time to revamp the Graphics Charts section! For 2012, we're increasing the number of games and resolutions, dividing the results into three segments. But that's not all. We also include GPGPU benchmarking, power consumption, temperature, and noise.
Get Tom's Hardware's best news and in-depth reviews, straight to your inbox.
You are now subscribed
Your newsletter sign-up was successful
Measuring Power Consumption
Measuring Power Draw
We were faced with the decision whether to measure the power draw of the entire test rig or just the individual cards. As measuring the entire rig isn't very transparent and doesn't yield comparable results, we chose to do it the hard way and measure the power dissipation of individual cards.
After conducting a lengthy series of measurements and test setups, we measured the power draw of our test rig without a graphics card at full CPU load. In order to minimize variance, we don’t use mechanical hard drives anymore, even though a disk-induced error would only be in the 2 or 3 W range. The PC is booted with a decades-old PCI graphics card, and the CPU maxed out with Prime95. Using this setup, we were able to determine a "baseline" draw of the system as 135 W.
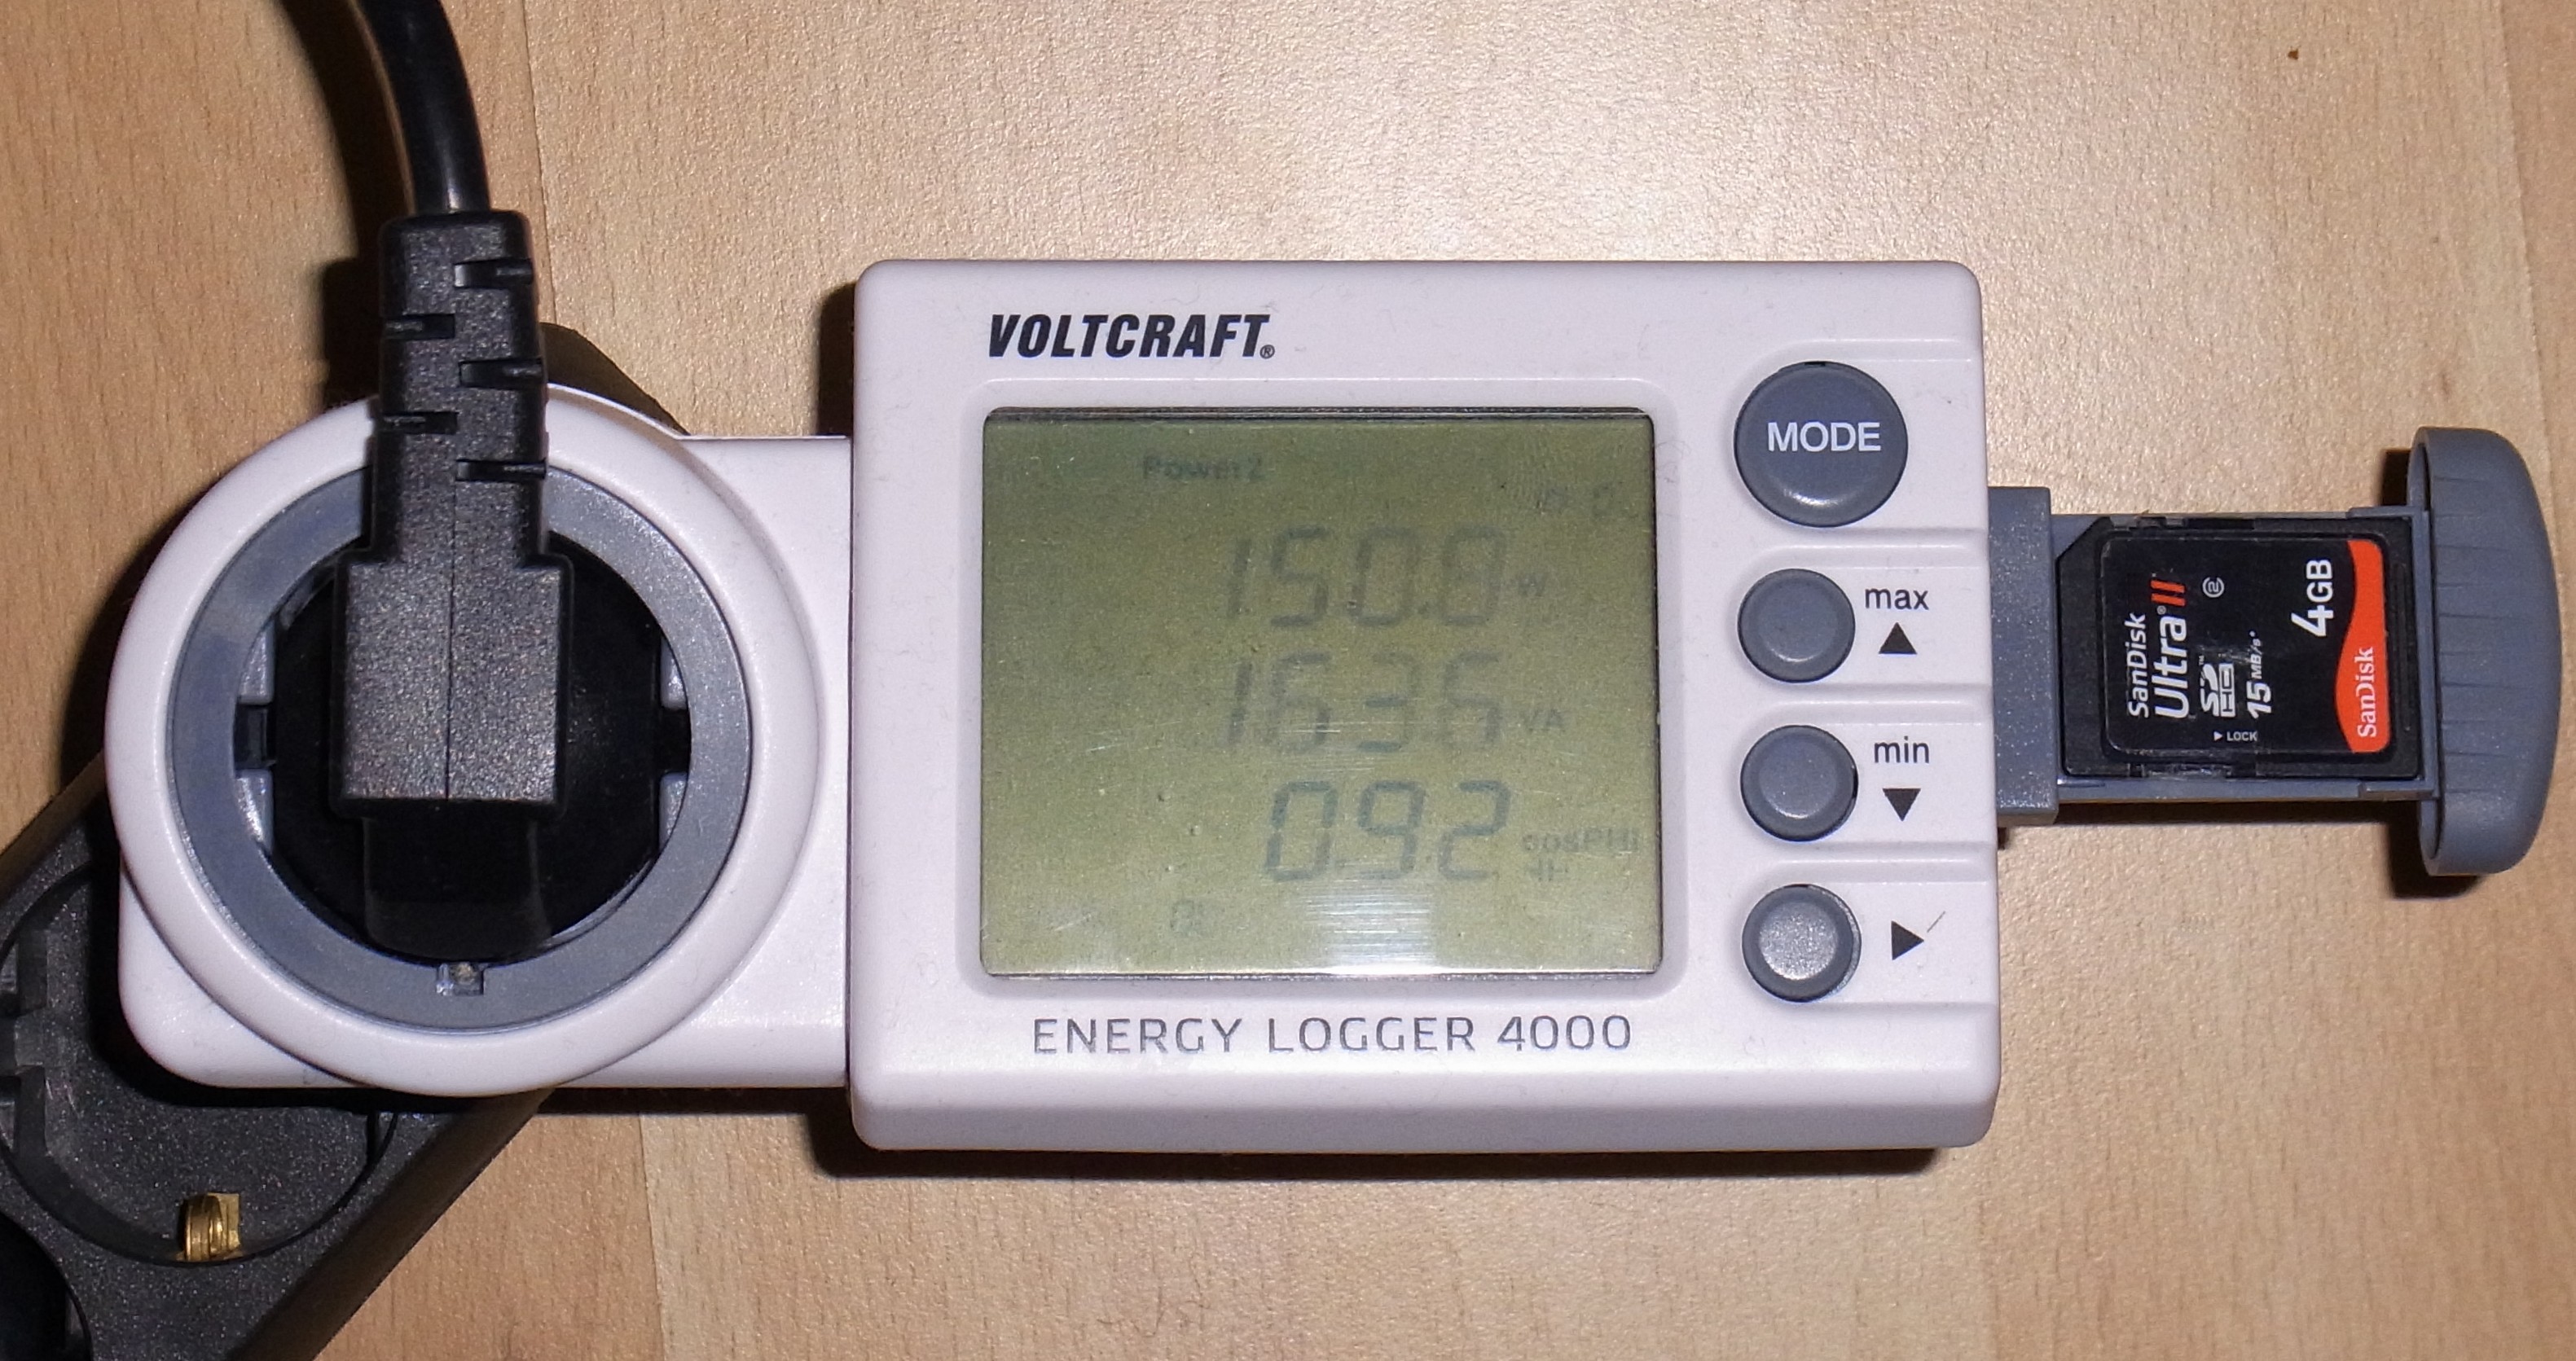
In order to measure the power draw of our test cards as precisely as possible, we keep the PCI-based VGA card in the system, in addition to the card being tested, and subject the CPU to a Prime95 load at low priority while performing the actual test. This way, any remaining CPU capacity is consumed by Prime95 without influencing the actual benchmark. The baseline value is then subtracted from the system power draw of the current benchmark. The picture above shows that this works quite well. With a Radeon HD 7970 at idle, the system draws 150 W. Subtracting 135 W from that yields an idle power draw of a mere 15 W for the Radeon 7970, which matches the manufacturer’s spec.
One issue that needs to be discussed has to do with the power supply. The efficiency of a power supply isn't constant, but it changes with the load that the power supply delivers. If we measure the baseline power draw above at a certain PSU load, increasing the load during a benchmark will change the PSU's efficiency and cause the baseline load to be higher; the same setup as before now results in more power draw (due to the lower overall efficiency).
When we compared the power draw that we measured on the (secondary) DC side with the difference between the actual (primary) AC side wattage and the baseline wattage of 135 W, we got quite similar values. Determining the efficiency curve of the power supply and adding that to the equation, we can further refine this measurement and cross-check the accuracy of the clamp meter used for these tests. After tabulating all these measurements, the maximum deviation we ever observed was 5 W at a total system power draw of 435 W and, thus, a graphics card-only power draw of 300 W. As this is a deviation of less than two percent, we consider our method of measuring power draw accurate enough.
Get Tom's Hardware's best news and in-depth reviews, straight to your inbox.
Current page: Measuring Power Consumption
Prev Page Measuring Temperatures Next Page More Data, More Transparency, And Better Recommendations
Igor Wallossek wrote a wide variety of hardware articles for Tom's Hardware, with a strong focus on technical analysis and in-depth reviews. His contributions have spanned a broad spectrum of PC components, including GPUs, CPUs, workstations, and PC builds. His insightful articles provide readers with detailed knowledge to make informed decisions in the ever-evolving tech landscape
-
johnny_utah While I love the new techniques, using BITCOIN to bench GPUGPU performance instead of Folding @ Home? Um, okay.Reply -
Still with the bar charts? Would *love* to see scatter plots with price/score on the axes... So much more useful in picking out a card.Reply
-
AznCracker Man the charts are dying to be updated. Too bad it isn't done more often since it takes a lot of work.Reply -
pharoahhalfdead johnny_utahWhile I love the new techniques, using BITCOIN to bench GPUGPU performance instead of Folding @ Home? Um, okay.Reply
I agree. I know Tom's spends a lot of time benchmarking, but Folding@home is something that is a bit more common. I would love to see F@H in some articles.
BTW, I appreciate all the work you guys do. -
randomkid Where's the 5760x1080? In the area where I come from, 3x 1920x1080p 22" monitor cost around the same or even less than a single 2560x1440/1600 27" monitor so this is a more likely configuration among gamers.Reply
The 5760x1080 resolution will also push the GPU's harder than a 2560x1440/1600 could so why limit the resolution there? -
Reply
We'll add up to 20 new boards each month until the lower end of the performance range is filled out, too.
How far back in GPU generations are you going to test, if at all? I saw the power consumption charts and could only see GTX 500, 600 and Radeon 6000, 7000 series. I have an EVGA GTX 480 SC for two years and do like to know how it compares to the newer series of GPUs. Much appreciated. -
Yargnit MMO FanYup no surprise here typical Nvidia benchmark suite fuck sakes.Reply
So what would YOU like to see used then? If they were trying to push Nvidia wouldn't Hawx 2 be in the suite? -
shinym For Starcraft II you say "This game doesn't stress the CPU, and is thus well-suited for GPU benchmarking." Looks like you got CPU and GPU mixed up there.Reply
