







Free open-source GPU task manager reveals exactly what's eating your VRAM — Microsoft VP's new GPU Taskman tool reveals every process using your GPU, how much memory each uses, and breaks down AI and LLM workloads
Open source tool is available for Windows, Linux, and macOS.
Microsoft VP Scott Hanselman has revealed a new open-source GitHub project called gputaskman. The name neatly encapsulates the headline role of this tool, a GPU-focused task manager, but its scope might be broader than you expect. This new tool for Windows, Linux, and macOS can show per-process GPU usage, VRAM consumption, active runtimes, and many more stats. It also breaks out AI/LLM task-specific information.
There's a lot going on in my GPU. I'm making a GPU Taskman to get insights to where my GPU memory is going. PRs welcome https://t.co/6FwKqnFWDWNovember 3, 2026
On social media, Hanselman snappily makes clear the technical itch that gputaskman was designed to scratch. “There's a lot going on in my GPU,” wrote the prominent public face of Microsoft's developer ecosystem. “I'm making a GPU Taskman to get insights to where my GPU memory is going.”
There are several example screenshots of GPU Taskman in use by the Microsoft VP. They clearly show the kinds of data that are presented in the terminal-like display that pops up in the tool. Hanselman’s tweet shows that the most VRAM-hungry app on his RTX 4080S system is the desktop windows manager. That is selected in the list, and more details are shown for this task at the bottom of the window. Also, we see AI/LLM apps consuming VRAM, and a few Windows staples.
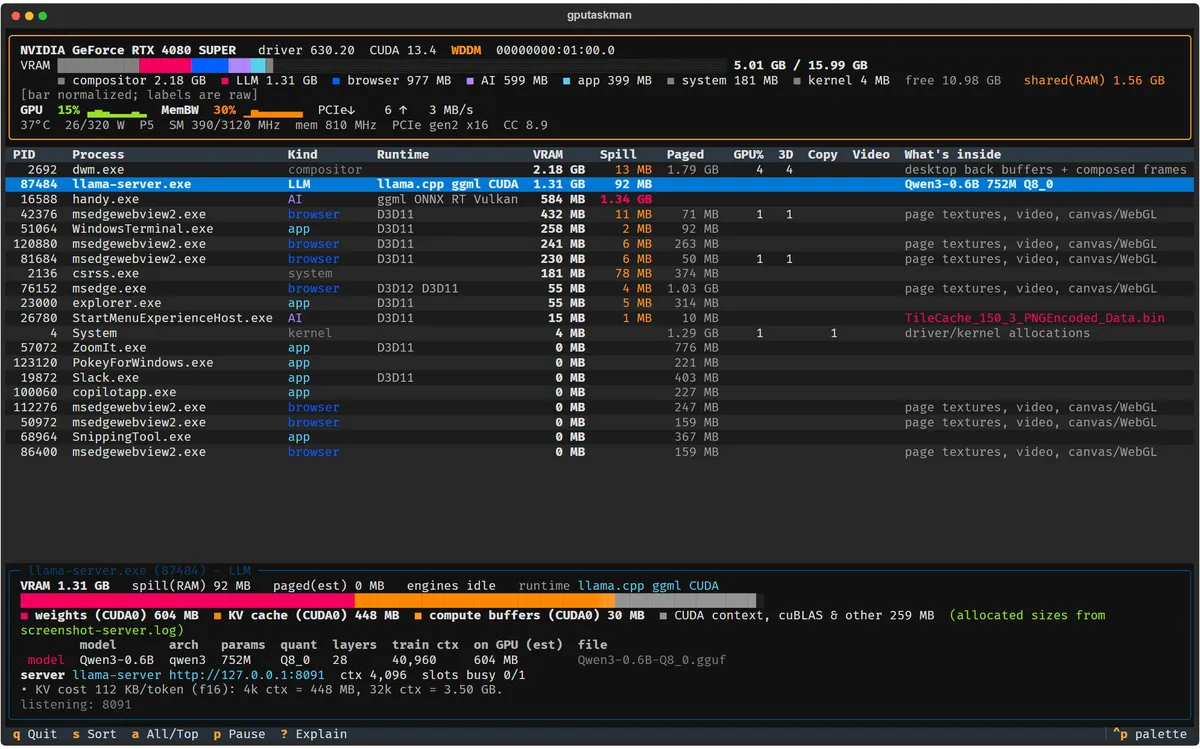
In a GitHub-embedded image, we see what details are broken out when the llama-server.exe app is selected in the list. The bottom of the window breakdown reveals that Qwen3-0.6B is being used, and there’s a breakdown of its weights, the KV cache, the number of parameters, and more. Very informative.
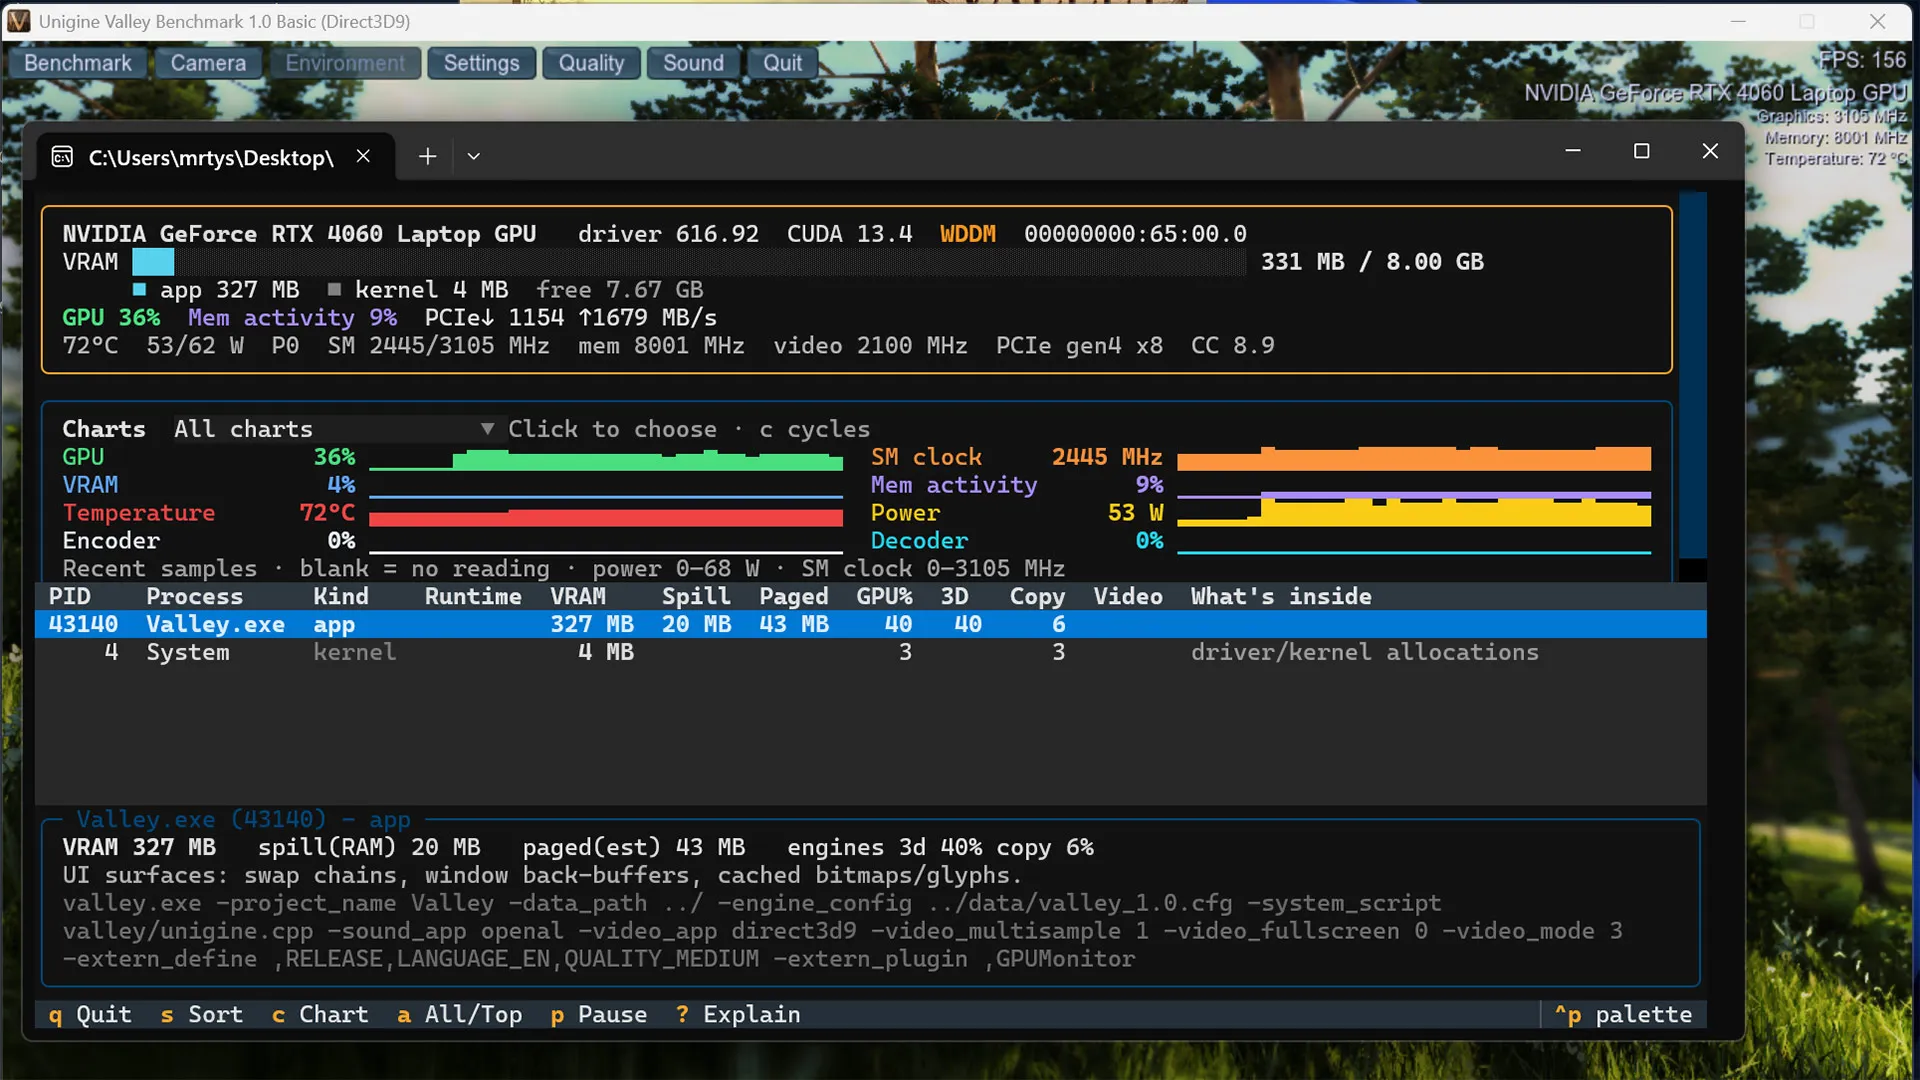
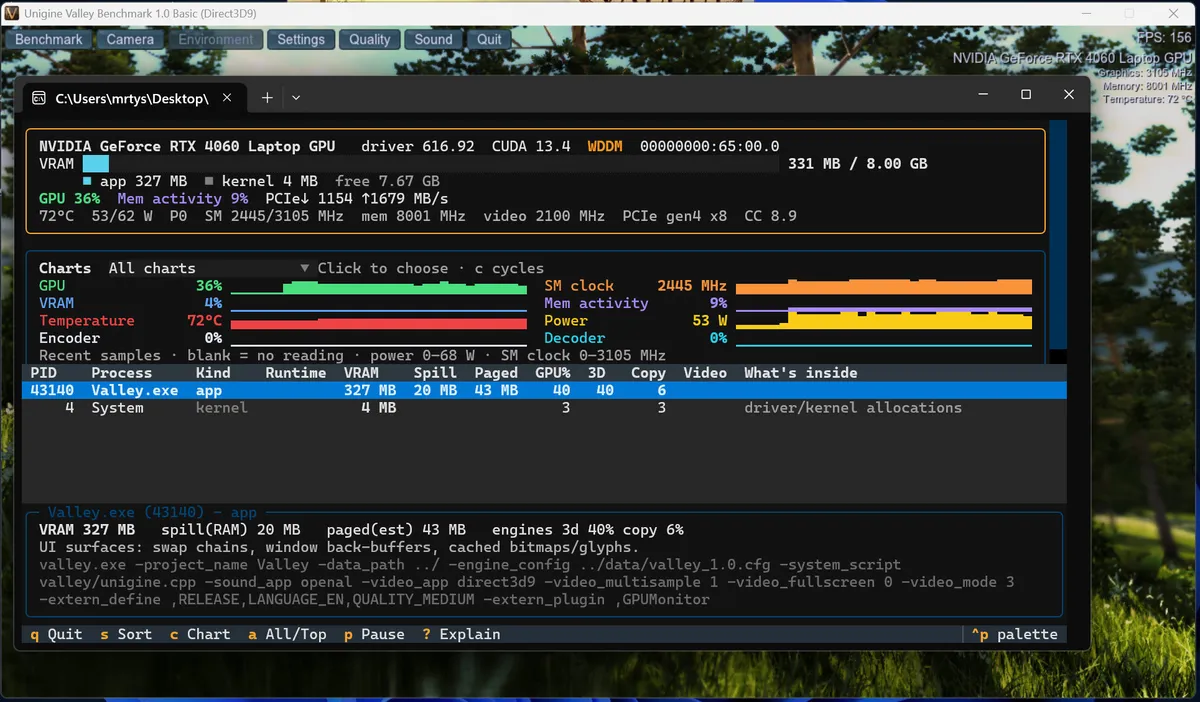
As the Microsoft developer has made portable Windows downloads of the latest v0.3.0 release of gputaskman, I couldn’t resist giving it a spin. Upon launch, I found that no tasks were using the discrete GPU in my laptop… so I fired up ye olde Unigine Valley GPU benchmark to stir the RTX 4060 from its slumber. I note the live-streaming charts showing GPU load, VRAM use, temperature, and so on are more prominent in my screenshot than in Hanselman’s examples. Perhaps he screen-shotted a previous version of the tool.
There’s a lot more information about gputaskman, its inner workings, and even its source code, on the linked GitHub repository. Hanselman is sharing his “experimental software” tool under the permissive MIT license. Finally, in social media comments, he hints that expanded GPU monitoring capabilities could be coming to Windows as standard.

Follow Tom's Hardware on Google News, or add us as a preferred source, to get our latest news, analysis, & reviews in your feeds.
Get Tom's Hardware's best news and in-depth reviews, straight to your inbox.

Mark Tyson is a news editor at Tom's Hardware. He enjoys covering the full breadth of PC tech; from business and semiconductor design to products approaching the edge of reason.
-
ezst036 Hmm.Reply
We have all of these task managers and process lists, yet can anybody actually identify the processes which go into feeding all of the OS-level advertisements?
I doubt Microsoft was nice enough to name it YourAnnoyingAdvertisements.exe. -
quorm Weird, it says all of my VRAM is being taken up by a datacenter two states over to help kids cheat on their history essays?Reply -
palladin9479 Ehh not that great unless it can also break down the sub categories that are allocating blocks. Most VRAM is just a resource cache, so listing total allocated doesn't help.Reply -
Lamarr the Strelok Nope. It took months to clean the crap out of W11.Adding more MS stuff would be a mistake for me.It's nice to work on Linux where you don't have to worry about what's creeping in the background.Reply -
Edward Jazzhands Mark Tyson yet again is presenting AI generated recreations of existing tools as if this is the first time it's ever been done. Although this new tool does look quite good, the way Tyson writes about them is often infuriating because every time he reports on one of these AI generated tools, he doesn't mention or even seem aware of the fact that this is merely a slight improvement over the other tools that already do this. He presents it as if this is a brand new idea and nobody has done this before. It's the exact same thing that vibe coders do when they post their AI slop recreations on Reddit and then act dumbfounded when people call them out for not even realizing they just generated a copy of an existing project.Reply -
splus I had to uninstall it - it uses too much CPU, not via its own process but via Windows main System process. It's good to use it for a short time just to see the VRAM usage, but not to leave it running in the background.Reply -
Nikolay Mihaylov Reply
Wut? It's a single Python process that uses less than 1% of a single core.splus said:I had to uninstall it - it uses too much CPU, not via its own process but via Windows main System process. It's good to use it for a short time just to see the VRAM usage, but not to leave it running in the background. -
splus Reply
Well, whatever that python process was doing had to do with or triggered the main Windows system process that was using at least 2 performance cores considerably. The moment I closed the cmd window with the GPU task manager it stopped.Nikolay Mihaylov said:Wut? It's a single Python process that uses less than 1% of a single core.