Why you can trust Tom's Hardware
Power Consumption
We used GPU-Z to log power consumption during the Metro: Exodus benchmark running at 2560 x 1440 with the default Ultra settings. The graphics card is warmed up before testing, and benchmarking begins when it settles to an idle temperature (about 10 minutes). The benchmark loops a total of five times, which yields around 10 minutes of testing. In the charts you will see a few blips in power use; this is a result of the benchmark starting the next loop.
We also use Furmark to capture worst-case power readings. Although both Nvidia and AMD consider the application to be a “power virus,” or program that deliberately taxes the components beyond normal limits, the data we gather from it offers useful information about a card’s capabilities.
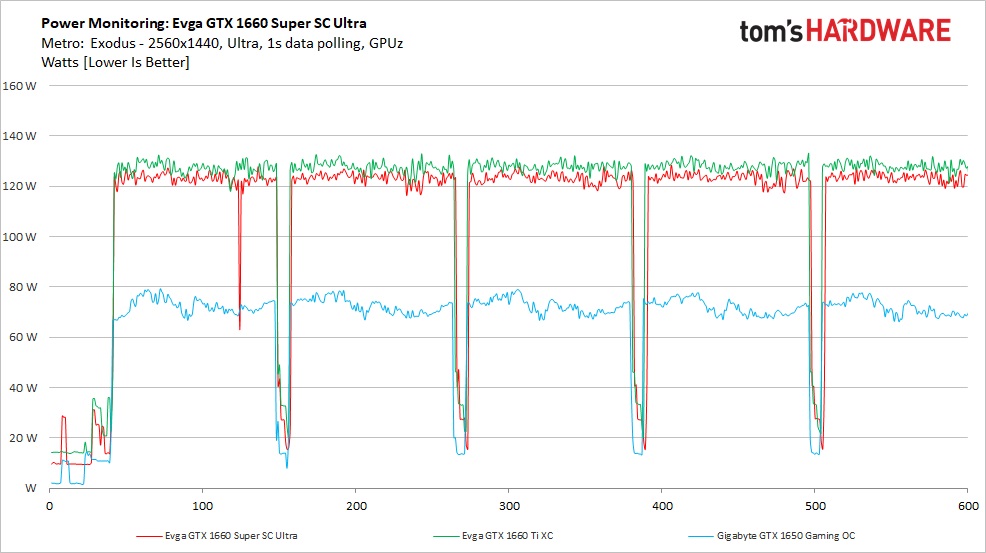
Starting with the gaming power results, the EVGA 1660 Super SC Ultra averaged 123W during the Metro: Exodus test. The slightly faster GTX 1660 Ti SC Ultra used 128W, which fits in well with the expected power use. The GTX 1650, a notably slower video card, sipped power at an average of 72W.
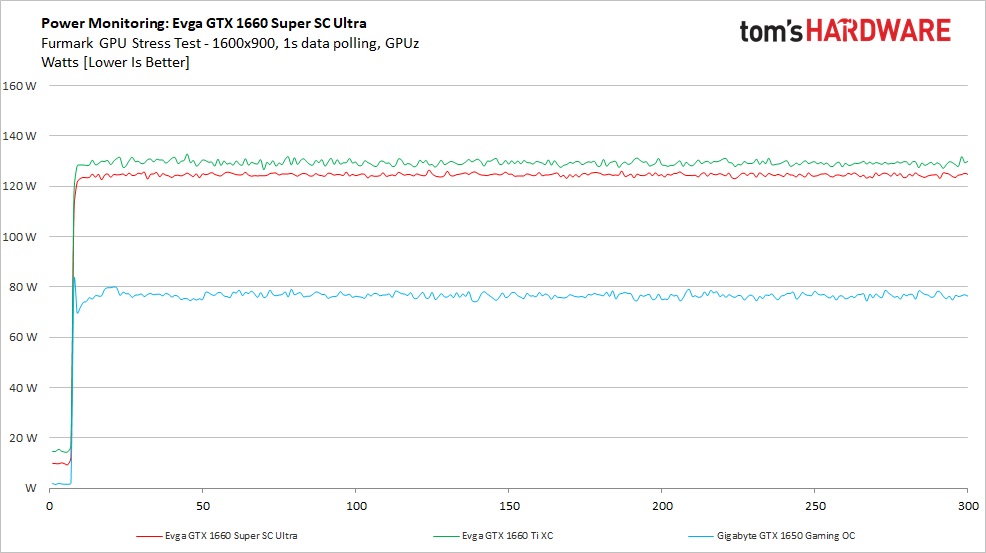
Due to the cards’ power management, Furmark’s power consumption doesn’t end up much higher than the gaming result, but it still tells a story. In this case, the 1660 Super SC averaged 125W, up a mere 2W from the Metro: Exodus value. We see the same theme with the 1660 Ti, with it consuming 130W, while the GTX 1650 was 77W. The latter card showed the biggest difference between the two tests.
Temperatures, Fan Speeds and Clock Rates
Gaming
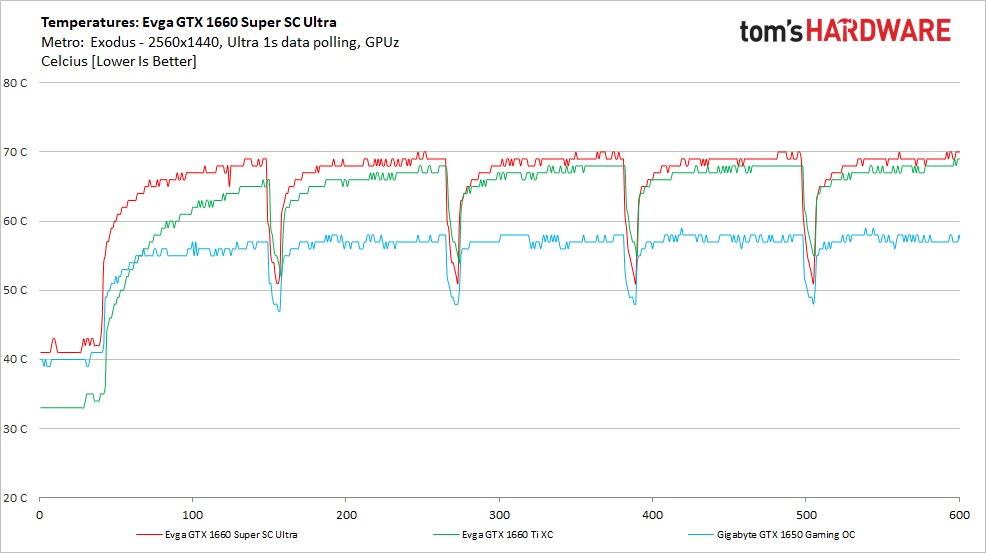
The EVGA GTX 1660 Super SC Ultra (in red) peaked at 70C during our testing run, which is the warmest of the group. Even with its dual fans, the smaller heatsink on this card let the temperatures run a bit higher than the EVGA GTX 1660 Ti XC, which peaked at 69C. Meanwhile, the low-powered GTX 1650 and its dual-fan cooling solution peaked at 58C during this testing.
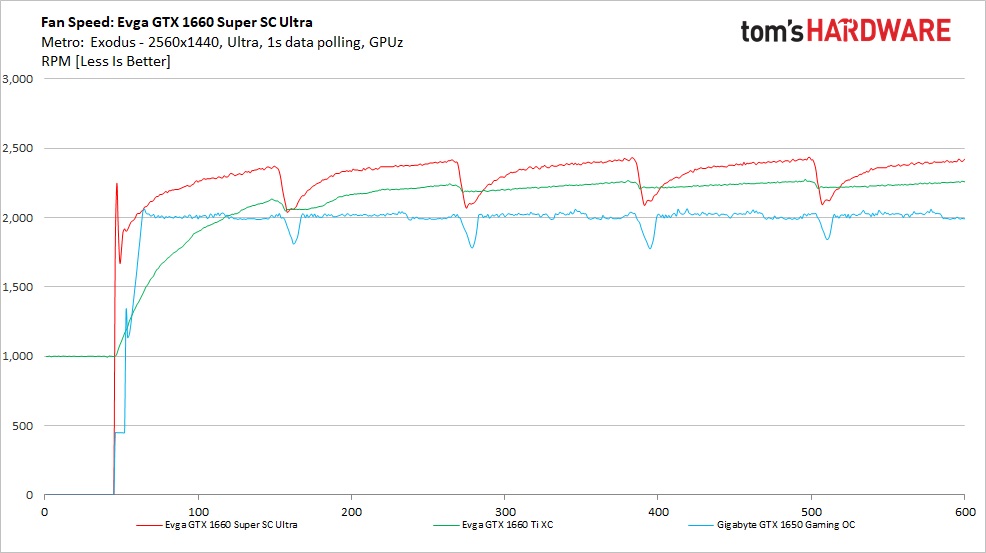
At first, the SC Ultra’s dual fans don't spin at all, and then ramp up as temperature increases. In the case of the Metro testing, the card’s fans went from zero RPM up to 1,900 RPM, then peaked around 2,400 RPM at the highest temperature. While the fans were audible during use, they were not loud and were quite tolerable throughout testing. We’re not going to compare them to the other cards in this testing as they are different tiers with different cooling solutions.
Get Tom's Hardware's best news and in-depth reviews, straight to your inbox.
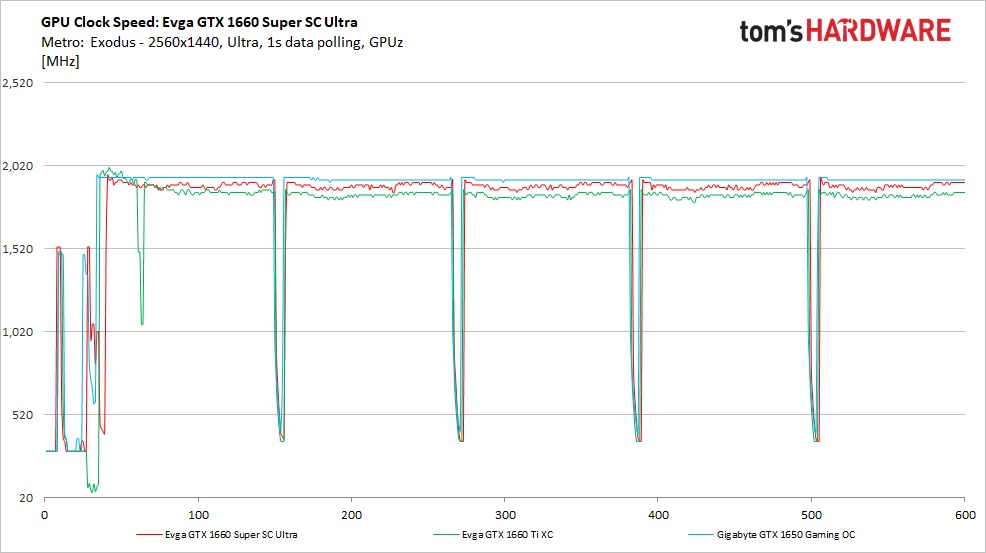
The GTX 1660 Super SC Ultra averaged 1,899 MHz under load during this set of tests. Examining the specifications list above and the GPU-Z data, we can see this is well over the rated boost, per usual. The card drops down, like most of the Turing based cards, to 300 MHz at idle.
Furmark
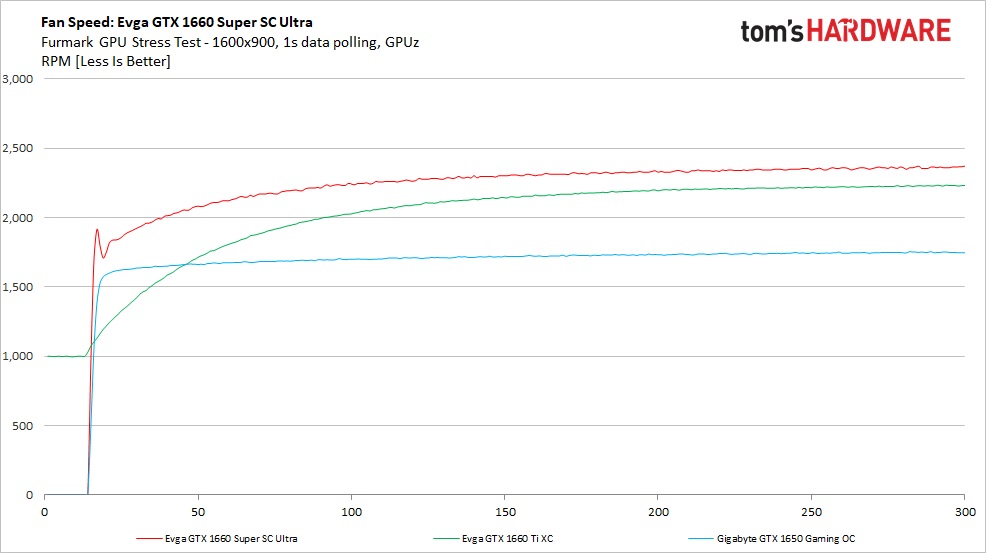
As we shift the focus to the more consistent and heavier load in Furmark, we see similar results as we saw on the gaming side, except the loads are consistent throughout. Surprisingly, temperatures did not increase with Furmark’s loads. And because of that, fan speeds slowly crept up to the same 2,400 RPM peak we measured during gaming.
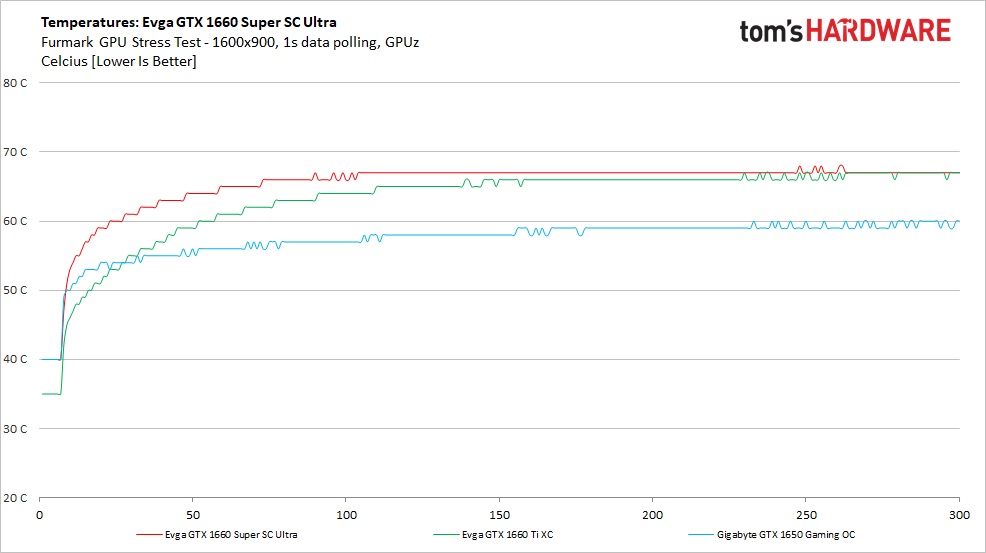
In fact, in regards to temperatures, peak temperature reached 68C, which is two degrees Celsius less than what we saw in gaming. This makes sense when looking at the significantly lower clock speeds and the card trying to fit under the power limit, and struggling to do so.
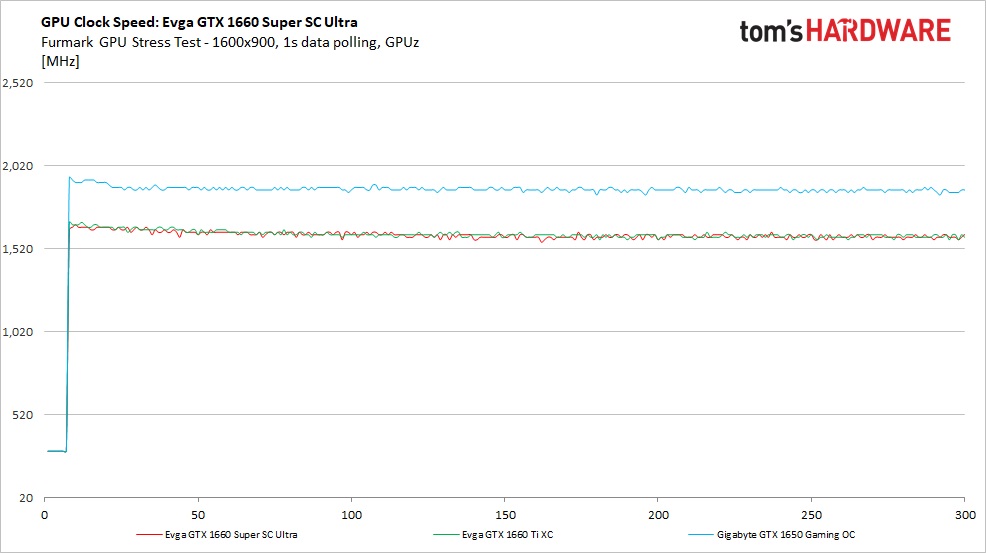
The GTX 1660 Super SC’s clock speeds in Furmark are much lower than what we saw in gaming. In this case, the card averaged 1,573 MHz throughout the test while under load. Compare that to 1,899 MHz during gaming, and we can confirm that the GPU is banging off the power limit and throttling clocks and voltage to fit within those parameters.
MORE: Best Graphics Cards
MORE: Desktop GPU Performance Hierarchy Table
MORE: All Graphics Content
Current page: Power Consumption, Fan Speeds, Clock Rates and Temperature
Prev Page Performance Results: 2560 X 1440 Next Page Software: EVGA Precision X1
Joe Shields is a staff writer at Tom’s Hardware. He reviews motherboards and PC components.
-
WildCard999 Pretty good for the money although I was hoping Nvidia would of released a dual fan reference version like the other Super cards.Reply -
TJ Hooker I don't know if I've ever seen a TH graphics card review that had so few cards being compared. Leaving out the 1660 non-super seems odd, as does the lack of RX 590 (and 580). Even a Vega 56 would have been a good addition IMO.Reply -
WildCard999 Reply
https://www.techspot.com/review/1935-nvidia-geforce-gtx-1660-super/TJ Hooker said:I don't know if I've ever seen a TH graphics card review that had such few cards being compared. Leaving out the 1660 non-super seems odd, as does the lack of RX 590 (and 580). Even a Vega 56 would have been a good addition IMO.
Covers a good amount of GPU's & games for 1080P/1440P. -
King_V ReplyTJ Hooker said:I don't know if I've ever seen a TH graphics card review that had such few cards being compared. Leaving out the 1660 non-super seems odd, as does the lack of RX 590 (and 580). Even a Vega 56 would have been a good addition IMO.
I think it's because of the new testing platform, thus the results on the new platform don't correspond correctly with the results from the previous platform? -
TJ Hooker Reply
Ah, yeah that makes sense. Looking at the RX 5700 XT Nitro+ review they did the same thing there.King_V said:I think it's because of the new testing platform, thus the results on the new platform don't correspond correctly with the results from the previous platform? -
hussainali88 I think there is a mistake on the first page. The Memory Capacity for all 1660 all variants should be 6GB not 8GB.Reply -
King_V I'm actually relieved to find out that it actually uses about the same, or slightly less power, than the 1660Ti. It seems like the 120W rating of the 1660Ti was slightly understated, and the 125W rating of the 1660 Super is about spot on. Maybe the 1660Ti should've been listed with a 130W rating?Reply
In any case, it does seem like the performance/price lands solidly in favor of the Super, and they're about tied in efficiency. -
RodroX HI, I think on the table by the first page of the article, were it said 8GB, shouldn't be 6GB instead?Reply