GPU Benchmarks from 2022–2024
Our 'legacy' GPU benchmarks used different hardware. Here are the details for the 2022–2024 configuration that used an Alder Lake 12900K CPU.
Tom's Hardware 2022–2024 GPU Testbed
Intel Core i9-12900K
MSI Pro Z690-A WiFi DDR4
Corsair 2x16GB DDR4-3600 CL16
Crucial P5 Plus 2TB
Cooler Master MWE 1250 V2 Gold
Cooler Master PL360 Flux
Cooler Master HAF500
Windows 11 Pro 64-bit
We have upgraded our test system and changed our test suite for 2025, effectively resetting our benchmarking and rankings. However, the old data — collected using a Core i9-12900K PC — remains valid. We aren't testing new GPUs with the old testbed, as that would double the time required for what is already a lengthy process, but we felt it would be helpful to some to keep the final data available.
We also had an interim system that never quite got wrapped up, which had a Core i9-13900K Raptor Lake CPU. Our original CPU was one of the impacted units that failed over time, which explains in retrospect why so much of the data felt a bit questionable. Thankfully, the new Ryzen 7 9800X3D system seems to be running just fine. Here are the 12900K results.
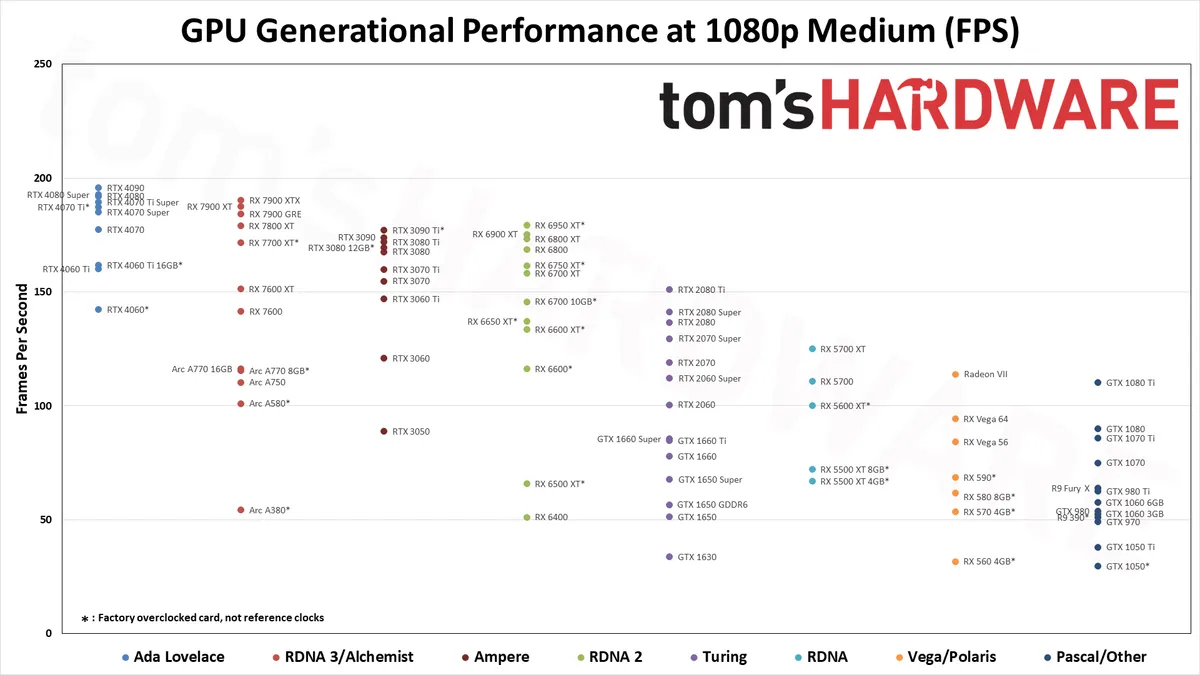
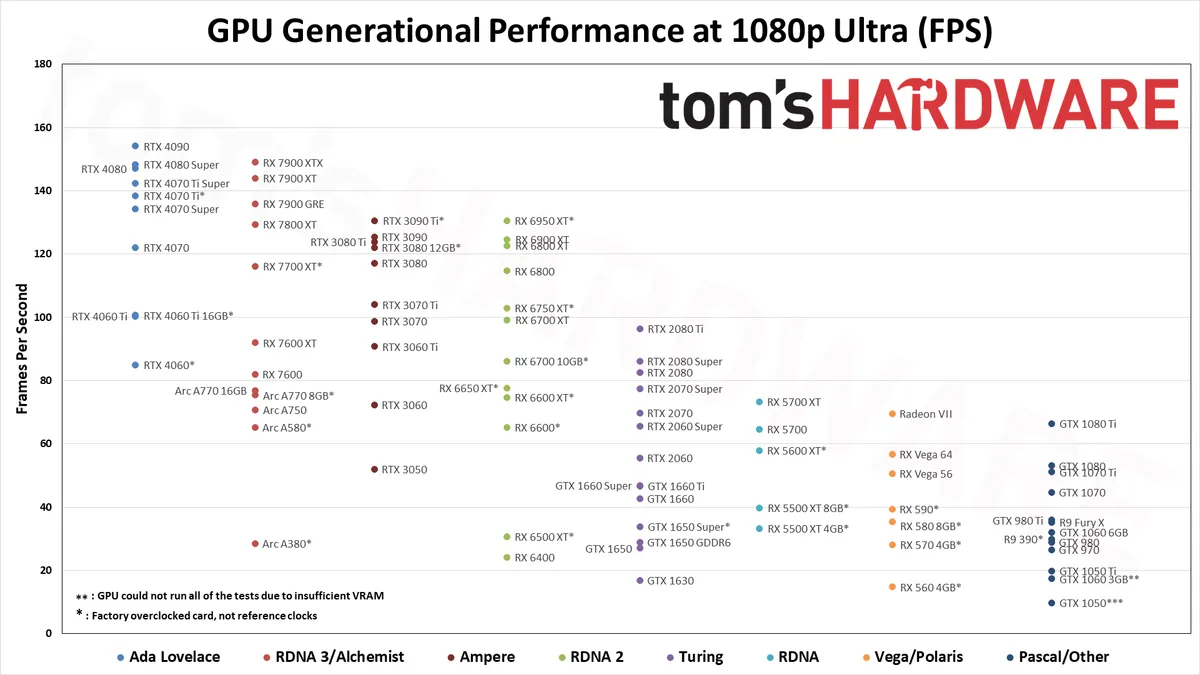
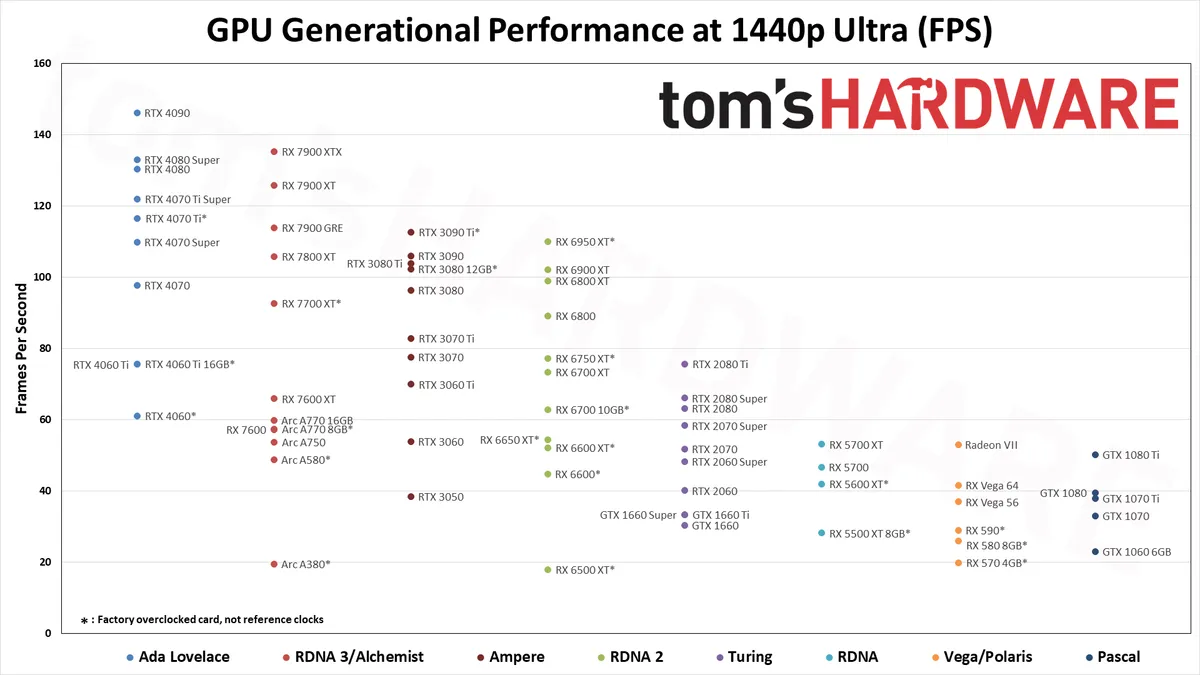
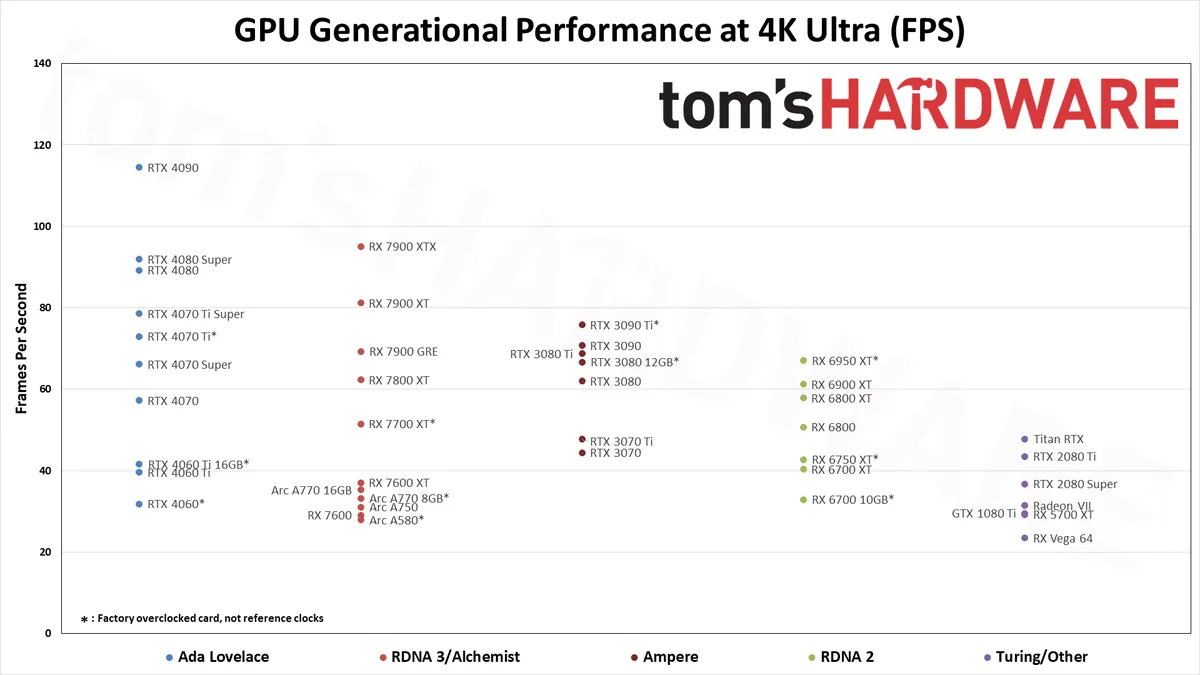
For these GPU benchmarks, we tested nearly every GPU released between 2016 and 2024, plus a few extras. All graphics cards were tested at 1080p medium and 1080p ultra, and we sorted the table by the 1080p ultra results. Where it made sense, we also tested at 1440p ultra and 4K ultra. All the scores are scaled relative to the top-ranking 1080p ultra card of the time, which in our suite is the RTX 4090 — especially at 4K and 1440p.
The above summary charts show the relative performance of the cards we've tested across the past several generations of hardware at 1080p ultra — swipe through the above gallery if you want to see the 1080p medium, 1440p, and 4K ultra images. There are a few missing options (e.g., the GT 1030, RX 550, and several Titan cards), but otherwise it's basically complete. Note that we also have data in the table below for some of the other older GPUs.
The eight games used for our standard GPU benchmarks hierarchy are Borderlands 3 (DX12), Far Cry 6 (DX12), Flight Simulator (DX11 Nvidia, DX12 AMD/Intel), Forza Horizon 5 (DX12), Horizon Zero Dawn (DX12), Red Dead Redemption 2 (Vulkan), Total War Warhammer 3 (DX11), and Watch Dogs Legion (DX12). The fps score is the geometric mean (equal weighting) of the eight games. Note that the specifications column links directly to our original review for the various GPUs.
Graphics Card | 1080p Ultra | 1080p Medium | 1440p Ultra | 4K Ultra | Specifications (Links to Review) |
|---|---|---|---|---|---|
100.0% (154.1fps) | 100.0% (195.7fps) | 100.0% (146.1fps) | 100.0% (114.5fps) | AD102, 16384 shaders, 2520MHz, 24GB GDDR6X@21Gbps, 1008GB/s, 450W | |
96.7% (149.0fps) | 97.2% (190.3fps) | 92.6% (135.3fps) | 83.1% (95.1fps) | Navi 31, 6144 shaders, 2500MHz, 24GB GDDR6@20Gbps, 960GB/s, 355W | |
96.2% (148.3fps) | 98.5% (192.7fps) | 91.0% (133.0fps) | 80.3% (91.9fps) | AD103, 10240 shaders, 2550MHz, 16GB GDDR6X@23Gbps, 736GB/s, 320W | |
95.4% (147.0fps) | 98.1% (192.0fps) | 89.3% (130.4fps) | 78.0% (89.3fps) | AD103, 9728 shaders, 2505MHz, 16GB GDDR6X@22.4Gbps, 717GB/s, 320W | |
93.4% (143.9fps) | 95.8% (187.6fps) | 86.1% (125.9fps) | 71.0% (81.2fps) | Navi 31, 5376 shaders, 2400MHz, 20GB GDDR6@20Gbps, 800GB/s, 315W | |
92.3% (142.3fps) | 96.8% (189.4fps) | 83.5% (122.0fps) | 68.7% (78.6fps) | AD103, 8448 shaders, 2610MHz, 16GB GDDR6X@21Gbps, 672GB/s, 285W | |
89.8% (138.3fps) | 95.7% (187.2fps) | 79.8% (116.5fps) | 63.8% (73.0fps) | AD104, 7680 shaders, 2610MHz, 12GB GDDR6X@21Gbps, 504GB/s, 285W | |
88.1% (135.8fps) | 94.1% (184.3fps) | 78.0% (113.9fps) | 60.5% (69.3fps) | Navi 31, 5120 shaders, 2245MHz, 16GB GDDR6@18Gbps, 576GB/s, 260W | |
87.1% (134.2fps) | 94.6% (185.1fps) | 75.2% (109.8fps) | 57.8% (66.1fps) | AD104, 7168 shaders, 2475MHz, 12GB GDDR6X@21Gbps, 504GB/s, 220W | |
84.7% (130.5fps) | 91.7% (179.4fps) | 75.3% (110.1fps) | 58.6% (67.1fps) | Navi 21, 5120 shaders, 2310MHz, 16GB GDDR6@18Gbps, 576GB/s, 335W | |
84.7% (130.5fps) | 90.5% (177.1fps) | 77.1% (112.7fps) | 66.3% (75.9fps) | GA102, 10752 shaders, 1860MHz, 24GB GDDR6X@21Gbps, 1008GB/s, 450W | |
83.9% (129.3fps) | 91.5% (179.1fps) | 72.4% (105.8fps) | 54.4% (62.3fps) | Navi 32, 3840 shaders, 2430MHz, 16GB GDDR6@19.5Gbps, 624GB/s, 263W | |
81.4% (125.5fps) | 88.9% (174.0fps) | 72.5% (106.0fps) | 61.8% (70.7fps) | GA102, 10496 shaders, 1695MHz, 24GB GDDR6X@19.5Gbps, 936GB/s, 350W | |
80.9% (124.6fps) | 89.6% (175.3fps) | 69.9% (102.1fps) | 53.5% (61.2fps) | Navi 21, 5120 shaders, 2250MHz, 16GB GDDR6@16Gbps, 512GB/s, 300W | |
80.4% (123.9fps) | 87.8% (171.8fps) | 71.1% (103.9fps) | 60.1% (68.8fps) | GA102, 10240 shaders, 1665MHz, 12GB GDDR6X@19Gbps, 912GB/s, 350W | |
79.6% (122.7fps) | 88.5% (173.2fps) | 67.8% (99.0fps) | 50.6% (57.9fps) | Navi 21, 4608 shaders, 2250MHz, 16GB GDDR6@16Gbps, 512GB/s, 300W | |
79.2% (122.1fps) | 86.5% (169.4fps) | 70.0% (102.3fps) | 58.3% (66.7fps) | GA102, 8960 shaders, 1845MHz, 12GB GDDR6X@19Gbps, 912GB/s, 400W | |
79.2% (122.0fps) | 90.7% (177.5fps) | 66.9% (97.8fps) | 50.0% (57.2fps) | AD104, 5888 shaders, 2475MHz, 12GB GDDR6X@21Gbps, 504GB/s, 200W | |
76.0% (117.0fps) | 85.6% (167.6fps) | 66.0% (96.4fps) | 54.1% (62.0fps) | GA102, 8704 shaders, 1710MHz, 10GB GDDR6X@19Gbps, 760GB/s, 320W | |
75.3% (116.1fps) | 87.7% (171.6fps) | 63.4% (92.7fps) | 45.0% (51.5fps) | Navi 32, 3456 shaders, 2544MHz, 12GB GDDR6@18Gbps, 432GB/s, 245W | |
74.4% (114.6fps) | 86.2% (168.7fps) | 61.0% (89.2fps) | 44.3% (50.7fps) | Navi 21, 3840 shaders, 2105MHz, 16GB GDDR6@16Gbps, 512GB/s, 250W | |
67.5% (104.0fps) | 81.6% (159.8fps) | 56.7% (82.8fps) | 41.7% (47.7fps) | GA104, 6144 shaders, 1770MHz, 8GB GDDR6X@19Gbps, 608GB/s, 290W | |
66.8% (102.9fps) | 82.6% (161.6fps) | 52.9% (77.2fps) | 37.4% (42.8fps) | Navi 22, 2560 shaders, 2600MHz, 12GB GDDR6@18Gbps, 432GB/s, 250W | |
65.3% (100.6fps) | 82.6% (161.7fps) | 51.8% (75.7fps) | 36.4% (41.6fps) | AD106, 4352 shaders, 2535MHz, 16GB GDDR6@18Gbps, 288GB/s, 160W | |
65.1% (100.4fps) | 81.8% (160.1fps) | 51.7% (75.6fps) | 34.6% (39.6fps) | AD106, 4352 shaders, 2535MHz, 8GB GDDR6@18Gbps, 288GB/s, 160W | |
64.5% (99.3fps) | 80.0% (156.6fps) | 54.4% (79.5fps) | 41.8% (47.8fps) | TU102, 4608 shaders, 1770MHz, 24GB GDDR6@14Gbps, 672GB/s, 280W | |
64.3% (99.1fps) | 80.8% (158.1fps) | 50.3% (73.4fps) | 35.3% (40.4fps) | Navi 22, 2560 shaders, 2581MHz, 12GB GDDR6@16Gbps, 384GB/s, 230W | |
64.1% (98.8fps) | 79.1% (154.8fps) | 53.2% (77.7fps) | 38.8% (44.4fps) | GA104, 5888 shaders, 1725MHz, 8GB GDDR6@14Gbps, 448GB/s, 220W | |
62.5% (96.3fps) | 77.2% (151.0fps) | 51.8% (75.6fps) | 38.0% (43.5fps) | TU102, 4352 shaders, 1545MHz, 11GB GDDR6@14Gbps, 616GB/s, 250W | |
59.7% (91.9fps) | 77.3% (151.2fps) | 45.1% (65.9fps) | 32.4% (37.1fps) | Navi 33, 2048 shaders, 2755MHz, 16GB GDDR6@18Gbps, 288GB/s, 190W | |
58.9% (90.7fps) | 75.0% (146.9fps) | 47.9% (70.0fps) | Row 30 - Cell 4 | GA104, 4864 shaders, 1665MHz, 8GB GDDR6@14Gbps, 448GB/s, 200W | |
55.9% (86.1fps) | 74.4% (145.7fps) | 43.0% (62.8fps) | 28.7% (32.9fps) | Navi 22, 2304 shaders, 2450MHz, 10GB GDDR6@16Gbps, 320GB/s, 175W | |
55.8% (86.0fps) | 72.2% (141.3fps) | 45.2% (66.1fps) | 32.1% (36.7fps) | TU104, 3072 shaders, 1815MHz, 8GB GDDR6@15.5Gbps, 496GB/s, 250W | |
55.1% (84.9fps) | 72.7% (142.3fps) | 41.9% (61.2fps) | 27.8% (31.9fps) | AD107, 3072 shaders, 2460MHz, 8GB GDDR6@17Gbps, 272GB/s, 115W | |
53.5% (82.5fps) | 69.8% (136.7fps) | 43.2% (63.2fps) | Row 34 - Cell 4 | TU104, 2944 shaders, 1710MHz, 8GB GDDR6@14Gbps, 448GB/s, 215W | |
53.2% (82.0fps) | 72.3% (141.4fps) | 39.2% (57.3fps) | 25.4% (29.1fps) | Navi 33, 2048 shaders, 2655MHz, 8GB GDDR6@18Gbps, 288GB/s, 165W | |
50.4% (77.7fps) | 70.0% (137.1fps) | 37.3% (54.5fps) | Row 36 - Cell 4 | Navi 23, 2048 shaders, 2635MHz, 8GB GDDR6@18Gbps, 280GB/s, 180W | |
50.3% (77.4fps) | 66.2% (129.6fps) | 40.0% (58.4fps) | Row 37 - Cell 4 | TU104, 2560 shaders, 1770MHz, 8GB GDDR6@14Gbps, 448GB/s, 215W | |
49.9% (76.9fps) | 59.4% (116.4fps) | 41.0% (59.8fps) | 30.8% (35.3fps) | ACM-G10, 4096 shaders, 2400MHz, 16GB GDDR6@17.5Gbps, 560GB/s, 225W | |
48.9% (75.3fps) | 59.0% (115.5fps) | 39.3% (57.5fps) | 29.0% (33.2fps) | ACM-G10, 4096 shaders, 2400MHz, 8GB GDDR6@16Gbps, 512GB/s, 225W | |
48.5% (74.7fps) | 68.2% (133.5fps) | 35.7% (52.2fps) | Row 40 - Cell 4 | Navi 23, 2048 shaders, 2589MHz, 8GB GDDR6@16Gbps, 256GB/s, 160W | |
47.6% (73.3fps) | 63.8% (124.9fps) | 36.3% (53.1fps) | 25.6% (29.3fps) | Navi 10, 2560 shaders, 1905MHz, 8GB GDDR6@14Gbps, 448GB/s, 225W | |
46.9% (72.3fps) | 61.8% (121.0fps) | 36.9% (54.0fps) | Row 42 - Cell 4 | GA106, 3584 shaders, 1777MHz, 12GB GDDR6@15Gbps, 360GB/s, 170W | |
45.9% (70.8fps) | 56.4% (110.4fps) | 36.7% (53.7fps) | 27.2% (31.1fps) | ACM-G10, 3584 shaders, 2350MHz, 8GB GDDR6@16Gbps, 512GB/s, 225W | |
45.3% (69.8fps) | 60.8% (119.1fps) | 35.5% (51.8fps) | Row 44 - Cell 4 | TU106, 2304 shaders, 1620MHz, 8GB GDDR6@14Gbps, 448GB/s, 175W | |
45.1% (69.5fps) | 58.2% (113.9fps) | 36.3% (53.0fps) | 27.5% (31.5fps) | Vega 20, 3840 shaders, 1750MHz, 16GB HBM2@2.0Gbps, 1024GB/s, 300W | |
43.1% (66.4fps) | 56.3% (110.2fps) | 34.4% (50.2fps) | 25.8% (29.5fps) | GP102, 3584 shaders, 1582MHz, 11GB GDDR5X@11Gbps, 484GB/s, 250W | |
42.5% (65.5fps) | 57.2% (112.0fps) | 33.1% (48.3fps) | Row 47 - Cell 4 | TU106, 2176 shaders, 1650MHz, 8GB GDDR6@14Gbps, 448GB/s, 175W | |
42.3% (65.2fps) | 59.3% (116.2fps) | 30.6% (44.8fps) | Row 48 - Cell 4 | Navi 23, 1792 shaders, 2491MHz, 8GB GDDR6@14Gbps, 224GB/s, 132W | |
42.3% (65.1fps) | 51.6% (101.1fps) | 33.4% (48.8fps) | 24.4% (27.9fps) | ACM-G10, 3072 shaders, 2300MHz, 8GB GDDR6@16Gbps, 512GB/s, 185W | |
41.9% (64.5fps) | 56.6% (110.8fps) | 31.9% (46.7fps) | Row 50 - Cell 4 | Navi 10, 2304 shaders, 1725MHz, 8GB GDDR6@14Gbps, 448GB/s, 180W | |
37.5% (57.8fps) | 51.1% (100.0fps) | 28.8% (42.0fps) | Row 51 - Cell 4 | Navi 10, 2304 shaders, 1750MHz, 8GB GDDR6@14Gbps, 336GB/s, 160W | |
36.8% (56.7fps) | 48.2% (94.3fps) | 28.5% (41.6fps) | 20.5% (23.5fps) | Vega 10, 4096 shaders, 1546MHz, 8GB HBM2@1.89Gbps, 484GB/s, 295W | |
36.0% (55.5fps) | 51.4% (100.5fps) | 27.5% (40.1fps) | Row 53 - Cell 4 | TU106, 1920 shaders, 1680MHz, 6GB GDDR6@14Gbps, 336GB/s, 160W | |
34.4% (53.0fps) | 45.9% (89.9fps) | 27.0% (39.4fps) | Row 54 - Cell 4 | GP104, 2560 shaders, 1733MHz, 8GB GDDR5X@10Gbps, 320GB/s, 180W | |
33.7% (51.9fps) | 45.4% (88.8fps) | 26.4% (38.5fps) | Row 55 - Cell 4 | GA106, 2560 shaders, 1777MHz, 8GB GDDR6@14Gbps, 224GB/s, 130W | |
33.1% (51.1fps) | 43.8% (85.7fps) | 26.0% (37.9fps) | Row 56 - Cell 4 | GP104, 2432 shaders, 1683MHz, 8GB GDDR5@8Gbps, 256GB/s, 180W | |
32.8% (50.6fps) | 43.0% (84.2fps) | 25.3% (37.0fps) | Row 57 - Cell 4 | Vega 10, 3584 shaders, 1471MHz, 8GB HBM2@1.6Gbps, 410GB/s, 210W | |
30.3% (46.8fps) | 43.7% (85.5fps) | 22.8% (33.3fps) | Row 58 - Cell 4 | TU116, 1408 shaders, 1785MHz, 6GB GDDR6@14Gbps, 336GB/s, 125W | |
30.3% (46.6fps) | 43.3% (84.8fps) | 22.8% (33.3fps) | Row 59 - Cell 4 | TU116, 1536 shaders, 1770MHz, 6GB GDDR6@12Gbps, 288GB/s, 120W | |
29.0% (44.7fps) | 38.3% (75.0fps) | 22.7% (33.1fps) | Row 60 - Cell 4 | GP104, 1920 shaders, 1683MHz, 8GB GDDR5@8Gbps, 256GB/s, 150W | |
27.7% (42.6fps) | 39.7% (77.8fps) | 20.8% (30.3fps) | Row 61 - Cell 4 | TU116, 1408 shaders, 1785MHz, 6GB GDDR5@8Gbps, 192GB/s, 120W | |
25.7% (39.7fps) | 36.8% (72.1fps) | 19.3% (28.2fps) | Row 62 - Cell 4 | Navi 14, 1408 shaders, 1845MHz, 8GB GDDR6@14Gbps, 224GB/s, 130W | |
25.5% (39.3fps) | 35.0% (68.5fps) | 19.9% (29.0fps) | Row 63 - Cell 4 | Polaris 30, 2304 shaders, 1545MHz, 8GB GDDR5@8Gbps, 256GB/s, 225W | |
23.3% (35.9fps) | 32.0% (62.6fps) | 18.2% (26.6fps) | Row 64 - Cell 4 | GM200, 2816 shaders, 1075MHz, 6GB GDDR5@7Gbps, 336GB/s, 250W | |
22.9% (35.3fps) | 31.5% (61.7fps) | 17.8% (26.0fps) | Row 65 - Cell 4 | Polaris 20, 2304 shaders, 1340MHz, 8GB GDDR5@8Gbps, 256GB/s, 185W | |
22.9% (35.2fps) | 32.6% (63.8fps) | Row 66 - Cell 3 | Row 66 - Cell 4 | ||
22.0% (33.9fps) | 34.6% (67.7fps) | 14.5% (21.2fps) | Row 67 - Cell 4 | TU116, 1280 shaders, 1725MHz, 4GB GDDR6@12Gbps, 192GB/s, 100W | |
21.6% (33.3fps) | 34.1% (66.8fps) | Row 68 - Cell 3 | Row 68 - Cell 4 | Navi 14, 1408 shaders, 1845MHz, 4GB GDDR6@14Gbps, 224GB/s, 130W | |
20.8% (32.1fps) | 29.5% (57.7fps) | 15.8% (23.0fps) | Row 69 - Cell 4 | GP106, 1280 shaders, 1708MHz, 6GB GDDR5@8Gbps, 192GB/s, 120W | |
19.9% (30.6fps) | 33.6% (65.8fps) | 12.3% (18.0fps) | Row 70 - Cell 4 | Navi 24, 1024 shaders, 2815MHz, 4GB GDDR6@18Gbps, 144GB/s, 107W | |
19.3% (29.8fps) | 26.1% (51.1fps) | Row 71 - Cell 3 | Row 71 - Cell 4 | Grenada, 2560 shaders, 1000MHz, 8GB GDDR5@6Gbps, 384GB/s, 275W | |
18.7% (28.9fps) | 27.4% (53.6fps) | Row 72 - Cell 3 | Row 72 - Cell 4 | GM204, 2048 shaders, 1216MHz, 4GB GDDR5@7Gbps, 256GB/s, 165W | |
18.7% (28.8fps) | 28.9% (56.6fps) | Row 73 - Cell 3 | Row 73 - Cell 4 | ||
18.4% (28.4fps) | 27.7% (54.3fps) | 13.3% (19.5fps) | Row 74 - Cell 4 | ACM-G11, 1024 shaders, 2450MHz, 6GB GDDR6@15.5Gbps, 186GB/s, 75W | |
18.2% (28.1fps) | 27.4% (53.6fps) | 13.6% (19.9fps) | Row 75 - Cell 4 | Polaris 20, 2048 shaders, 1244MHz, 4GB GDDR5@7Gbps, 224GB/s, 150W | |
17.5% (27.0fps) | 26.2% (51.3fps) | Row 76 - Cell 3 | Row 76 - Cell 4 | ||
17.2% (26.5fps) | 25.0% (49.0fps) | Row 77 - Cell 3 | Row 77 - Cell 4 | GM204, 1664 shaders, 1178MHz, 4GB GDDR5@7Gbps, 256GB/s, 145W | |
15.7% (24.1fps) | 26.1% (51.1fps) | Row 78 - Cell 3 | Row 78 - Cell 4 | Navi 24, 768 shaders, 2321MHz, 4GB GDDR6@16Gbps, 128GB/s, 53W | |
12.9% (19.8fps) | 19.4% (38.0fps) | Row 79 - Cell 3 | Row 79 - Cell 4 | ||
| Row 80 - Cell 1 | 26.8% (52.5fps) | Row 80 - Cell 3 | Row 80 - Cell 4 | GP106, 1152 shaders, 1708MHz, 3GB GDDR5@8Gbps, 192GB/s, 120W | |
10.9% (16.9fps) | 17.3% (33.8fps) | Row 81 - Cell 3 | Row 81 - Cell 4 | ||
9.6% (14.7fps) | 16.2% (31.7fps) | Row 82 - Cell 3 | Row 82 - Cell 4 | Baffin, 1024 shaders, 1275MHz, 4GB GDDR5@7Gbps, 112GB/s, 60-80W | |
| Row 83 - Cell 1 | 15.2% (29.7fps) | Row 83 - Cell 3 | Row 83 - Cell 4 | ||
| Row 84 - Cell 1 | 10.0% (19.5fps) | Row 84 - Cell 3 | Row 84 - Cell 4 | ||
| Row 85 - Cell 1 | 7.5% (14.6fps) | Row 85 - Cell 3 | Row 85 - Cell 4 |
*: GPU couldn't run all tests, so the overall score is slightly skewed at 1080p ultra.
While the RTX 4090 does technically take first place at 1080p ultra, it's the 1440p and especially 4K numbers that impress. It's less than 2% faster than the RTX 4080 Super at 1080p ultra, but that increases to 9% at 1440p and then 25% at 4K. Also note that the fps numbers in our table incorporate both the average and minimum fps into a single score — with the average given more weight than the 1% low fps.
Again, keep in mind that we're not including any ray tracing or DLSS results in the above table, as we use the same test suite with the same settings on all current and previous generation graphics cards. Since only RTX cards support DLSS (and RTX 40-series if you want DLSS 3), that would drastically limit which cards we could directly compare. You can see DLSS 2/3 and FSR 2 upscaling results in our RTX 4070 review if you want to check out how the various upscaling modes can help.
The RTX 4090 comes at a steep price, though on paper it's not that much worse than the previous generation RTX 3090. In fact, we'd say it's a lot better in some respects, as the 3090 was only a minor improvement in performance compared to the 3080 at the time of launch, but with more than double the VRAM. Nvidia pulled out all the stops with the 4090, increasing the core counts, clock speeds, and power limits to push it beyond all contenders. There are two problems with the 4090, however: It's not available at MSRP any longer, due to demand from the AI sector — it often costs $2,000 or more — and there are still concerns with pulling 450W of power over the 16-pin connector.
Stepping down from the RTX 4090, the RTX 4080 Super and RX 7900 XTX trade blows at higher resolutions, while CPU bottlenecks come into play at 1080p. We'll be switching our testbed in the near future, with the current results from our 13900K testing in the charts at the bottom of the page.
Outside of the latest releases from AMD and Nvidia, the RX 6000- and RTX 30-series chips still perform reasonably well and if you're using such a card, there may not be any need to upgrade at present. Intel's Arc GPUs also fall into this category and are something of a wild card.
We've been testing and retesting GPUs periodically, and the Arc chips running the latest drivers now complete all of our benchmarks without any major anomalies. (Minecraft was previously a problem, though Intel has finally sorted that out.) They're not great on efficiency, but overall performance and pricing for the A750 is quite good.
Turning to the previous generation GPUs, the RTX 20-series and GTX 16-series chips end up scattered throughout the results, along with the RX 5000-series. The general rule of thumb is that you get one or two "model upgrades" with the newer architectures, so for example the RTX 2080 Super comes in just below the RTX 3060 Ti, while the RX 5700 XT basically matches the newer and less expensive RX 6600 XT.
Go back far enough and you can see how modern games at ultra settings severely punish cards that don't have more than 4GB VRAM. We've been saying for a few years now that 4GB was just scraping by, and these days we'd avoid buying anything with less than 8GB of VRAM — 12GB or more is the minimum we'd want with a mainstream GPU, and 16GB or more for high-end and above. Old cards like the GTX 1060 3GB and GTX 1050 actually failed to run some of our tests, which skews their results a bit, even though they do better at 1080p medium.
Now let's switch over to the ray tracing hierarchy.

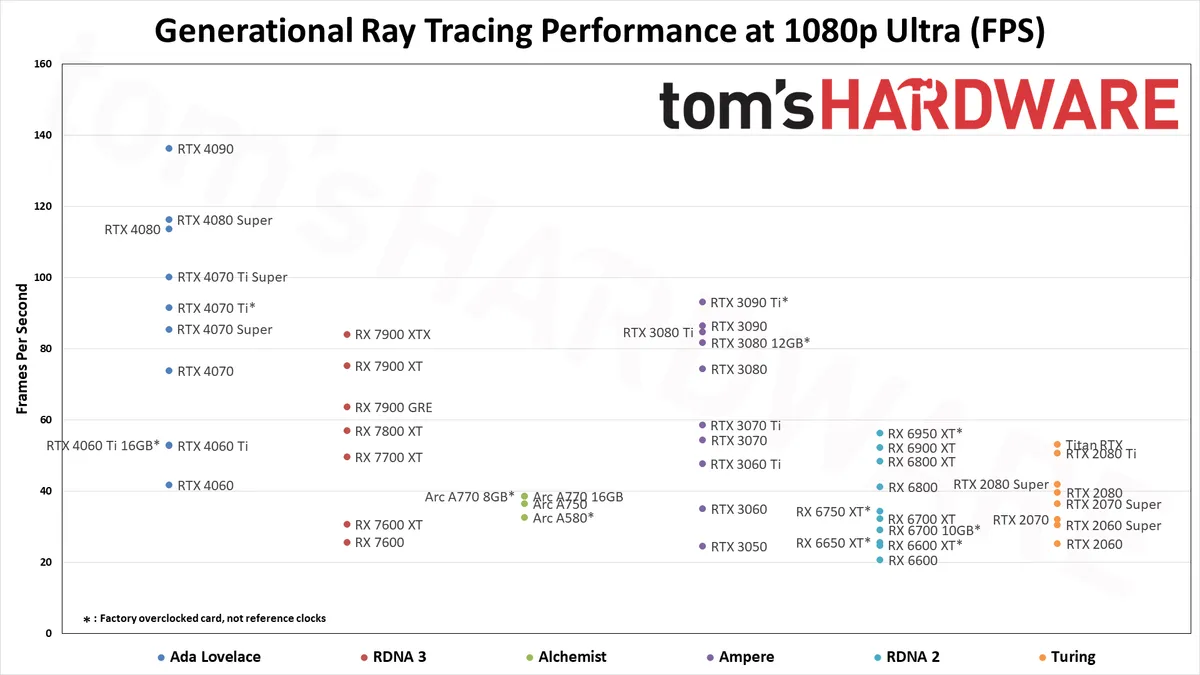
Ray Tracing GPU Benchmarks 2022–2024
Enabling ray tracing, particularly with demanding games like many of those we're using in our DXR test suite, can cause framerates to drop off a cliff. We're testing with "medium" and "ultra" ray tracing settings. Medium generally means using the medium graphics preset but turning on ray tracing effects (set to "medium" if that's an option; otherwise, "on"), while ultra turns on all of the RT options at more or less maximum quality.
Because ray tracing is so much more demanding, we're sorting these results by the 1080p medium scores. That's also because the RX 6500 XT, RX 6400, and Arc A380 basically can't handle ray tracing even at these settings, and testing at anything more than 1080p medium would be fruitless.
The five ray tracing games used are Bright Memory Infinite, Control Ultimate Edition, Cyberpunk 2077, Metro Exodus Enhanced, and Minecraft — all of these use the DirectX 12 / DX12 Ultimate API. The fps score is the geometric mean (equal weighting) of the five games, and the percentage is scaled relative to the fastest GPU in the list, which again is the GeForce RTX 4090.
If you want to see what the future may hold with ray tracing, check out our Alan Wake 2 benchmarks where the full path tracing barely manages playable performance even with upscaling on non-Nvidia GPUs. However, and this is a critical point, the number of games where RT truly makes a striking difference in visuals is extremely limited. For most games, we still feel running pure rasterization rendering makes more sense.

Graphics Card | 1080p Medium | 1080p Ultra | 1440p Ultra | 4K Ultra | Specifications (Links to Review) |
|---|---|---|---|---|---|
100.0% (165.9fps) | 100.0% (136.3fps) | 100.0% (103.9fps) | 100.0% (55.9fps) | AD102, 16384 shaders, 2520MHz, 24GB GDDR6X@21Gbps, 1008GB/s, 450W | |
86.8% (144.0fps) | 85.3% (116.3fps) | 75.6% (78.6fps) | 70.5% (39.4fps) | AD103, 10240 shaders, 2550MHz, 16GB GDDR6X@23Gbps, 736GB/s, 320W | |
85.4% (141.6fps) | 83.4% (113.6fps) | 73.1% (76.0fps) | 67.7% (37.8fps) | AD103, 9728 shaders, 2505MHz, 16GB GDDR6X@22.4Gbps, 717GB/s, 320W | |
77.3% (128.2fps) | 73.5% (100.3fps) | 63.5% (66.0fps) | 58.4% (32.6fps) | AD103, 8448 shaders, 2610MHz, 16GB GDDR6X@21Gbps, 672GB/s, 285W | |
71.9% (119.3fps) | 68.4% (93.2fps) | 59.6% (62.0fps) | 56.9% (31.8fps) | GA102, 10752 shaders, 1860MHz, 24GB GDDR6X@21Gbps, 1008GB/s, 450W | |
71.5% (118.6fps) | 67.1% (91.6fps) | 56.9% (59.1fps) | 52.3% (29.2fps) | AD104, 7680 shaders, 2610MHz, 12GB GDDR6X@21Gbps, 504GB/s, 285W | |
68.1% (113.0fps) | 62.7% (85.6fps) | 52.4% (54.5fps) | 47.8% (26.7fps) | AD104, 7168 shaders, 2475MHz, 12GB GDDR6X@21Gbps, 504GB/s, 220W | |
67.7% (112.4fps) | 63.5% (86.6fps) | 55.1% (57.2fps) | 51.8% (28.9fps) | GA102, 10496 shaders, 1695MHz, 24GB GDDR6X@19.5Gbps, 936GB/s, 350W | |
66.5% (110.4fps) | 62.2% (84.8fps) | 53.2% (55.3fps) | 48.6% (27.1fps) | GA102, 10240 shaders, 1665MHz, 12GB GDDR6X@19Gbps, 912GB/s, 350W | |
66.1% (109.6fps) | 61.7% (84.1fps) | 53.2% (55.3fps) | 48.6% (27.2fps) | Navi 31, 6144 shaders, 2500MHz, 24GB GDDR6@20Gbps, 960GB/s, 355W | |
64.9% (107.6fps) | 59.9% (81.7fps) | 50.8% (52.8fps) | 46.3% (25.8fps) | GA102, 8960 shaders, 1845MHz, 12GB GDDR6X@19Gbps, 912GB/s, 400W | |
61.2% (101.4fps) | 54.2% (73.9fps) | 45.1% (46.9fps) | 40.7% (22.7fps) | AD104, 5888 shaders, 2475MHz, 12GB GDDR6X@21Gbps, 504GB/s, 200W | |
60.4% (100.3fps) | 55.3% (75.3fps) | 46.7% (48.5fps) | 41.6% (23.3fps) | Navi 31, 5376 shaders, 2400MHz, 20GB GDDR6@20Gbps, 800GB/s, 315W | |
60.2% (99.8fps) | 54.5% (74.3fps) | 46.1% (47.9fps) | 41.8% (23.3fps) | GA102, 8704 shaders, 1710MHz, 10GB GDDR6X@19Gbps, 760GB/s, 320W | |
52.9% (87.7fps) | 46.8% (63.7fps) | 39.6% (41.2fps) | 35.7% (19.9fps) | Navi 31, 5120 shaders, 2245MHz, 16GB GDDR6@18Gbps, 576GB/s, 260W | |
50.6% (84.0fps) | 43.0% (58.6fps) | 35.7% (37.1fps) | Row 15 - Cell 4 | GA104, 6144 shaders, 1770MHz, 8GB GDDR6X@19Gbps, 608GB/s, 290W | |
48.3% (80.1fps) | 41.4% (56.4fps) | 34.3% (35.7fps) | 31.0% (17.3fps) | Navi 21, 5120 shaders, 2310MHz, 16GB GDDR6@18Gbps, 576GB/s, 335W | |
47.2% (78.2fps) | 39.9% (54.4fps) | 32.8% (34.1fps) | Row 17 - Cell 4 | GA104, 5888 shaders, 1725MHz, 8GB GDDR6@14Gbps, 448GB/s, 220W | |
46.7% (77.5fps) | 41.9% (57.1fps) | 34.9% (36.3fps) | 31.0% (17.3fps) | Navi 32, 3840 shaders, 2430MHz, 16GB GDDR6@19.5Gbps, 624GB/s, 263W | |
45.4% (75.4fps) | 38.3% (52.3fps) | 32.1% (33.3fps) | 28.8% (16.1fps) | Navi 21, 5120 shaders, 2250MHz, 16GB GDDR6@16Gbps, 512GB/s, 300W | |
45.2% (75.1fps) | 38.7% (52.8fps) | 32.3% (33.5fps) | 24.8% (13.9fps) | AD106, 4352 shaders, 2535MHz, 8GB GDDR6@18Gbps, 288GB/s, 160W | |
45.2% (75.0fps) | 38.8% (53.0fps) | 32.7% (34.0fps) | 29.5% (16.5fps) | AD106, 4352 shaders, 2535MHz, 16GB GDDR6@18Gbps, 288GB/s, 160W | |
44.8% (74.4fps) | 39.1% (53.3fps) | 33.7% (35.0fps) | 31.2% (17.4fps) | TU102, 4608 shaders, 1770MHz, 24GB GDDR6@14Gbps, 672GB/s, 280W | |
42.7% (70.9fps) | 37.2% (50.7fps) | 31.6% (32.9fps) | Row 23 - Cell 4 | TU102, 4352 shaders, 1545MHz, 11GB GDDR6@14Gbps, 616GB/s, 250W | |
42.2% (70.0fps) | 35.6% (48.5fps) | 29.9% (31.1fps) | 26.8% (15.0fps) | Navi 21, 4608 shaders, 2250MHz, 16GB GDDR6@16Gbps, 512GB/s, 300W | |
41.9% (69.5fps) | 35.0% (47.7fps) | 28.8% (30.0fps) | Row 25 - Cell 4 | GA104, 4864 shaders, 1665MHz, 8GB GDDR6@14Gbps, 448GB/s, 200W | |
41.3% (68.4fps) | 36.5% (49.7fps) | 30.6% (31.8fps) | 27.2% (15.2fps) | Navi 32, 3456 shaders, 2544MHz, 12GB GDDR6@18Gbps, 432GB/s, 245W | |
36.3% (60.1fps) | 30.2% (41.2fps) | 25.4% (26.3fps) | Row 27 - Cell 4 | Navi 21, 3840 shaders, 2105MHz, 16GB GDDR6@16Gbps, 512GB/s, 250W | |
35.8% (59.4fps) | 30.8% (42.0fps) | 26.1% (27.1fps) | Row 28 - Cell 4 | TU104, 3072 shaders, 1815MHz, 8GB GDDR6@15.5Gbps, 496GB/s, 250W | |
35.4% (58.8fps) | 30.6% (41.7fps) | 24.9% (25.8fps) | Row 29 - Cell 4 | AD107, 3072 shaders, 2460MHz, 8GB GDDR6@17Gbps, 272GB/s, 115W | |
34.4% (57.1fps) | 29.1% (39.7fps) | 24.6% (25.5fps) | Row 30 - Cell 4 | TU104, 2944 shaders, 1710MHz, 8GB GDDR6@14Gbps, 448GB/s, 215W | |
32.7% (54.2fps) | 28.4% (38.7fps) | 24.0% (24.9fps) | Row 31 - Cell 4 | ACM-G10, 4096 shaders, 2400MHz, 8GB GDDR6@16Gbps, 512GB/s, 225W | |
32.6% (54.1fps) | 28.3% (38.6fps) | 25.3% (26.2fps) | Row 32 - Cell 4 | ACM-G10, 4096 shaders, 2400MHz, 16GB GDDR6@17.5Gbps, 560GB/s, 225W | |
31.7% (52.5fps) | 25.7% (35.1fps) | 21.1% (22.0fps) | Row 33 - Cell 4 | GA106, 3584 shaders, 1777MHz, 12GB GDDR6@15Gbps, 360GB/s, 170W | |
31.6% (52.4fps) | 26.8% (36.6fps) | 22.3% (23.1fps) | Row 34 - Cell 4 | TU104, 2560 shaders, 1770MHz, 8GB GDDR6@14Gbps, 448GB/s, 215W | |
30.7% (51.0fps) | 26.8% (36.6fps) | 22.6% (23.5fps) | Row 35 - Cell 4 | ACM-G10, 3584 shaders, 2350MHz, 8GB GDDR6@16Gbps, 512GB/s, 225W | |
30.0% (49.8fps) | 25.3% (34.5fps) | 20.7% (21.5fps) | Row 36 - Cell 4 | Navi 22, 2560 shaders, 2600MHz, 12GB GDDR6@18Gbps, 432GB/s, 250W | |
28.1% (46.6fps) | 23.7% (32.3fps) | 19.1% (19.9fps) | Row 37 - Cell 4 | Navi 22, 2560 shaders, 2581MHz, 12GB GDDR6@16Gbps, 384GB/s, 230W | |
27.9% (46.3fps) | 23.5% (32.1fps) | 19.7% (20.4fps) | Row 38 - Cell 4 | TU106, 2304 shaders, 1620MHz, 8GB GDDR6@14Gbps, 448GB/s, 175W | |
27.5% (45.6fps) | 24.0% (32.7fps) | 20.3% (21.1fps) | Row 39 - Cell 4 | ACM-G10, 3072 shaders, 2300MHz, 8GB GDDR6@16Gbps, 512GB/s, 185W | |
26.8% (44.5fps) | 22.4% (30.5fps) | 18.5% (19.3fps) | Row 40 - Cell 4 | TU106, 2176 shaders, 1650MHz, 8GB GDDR6@14Gbps, 448GB/s, 175W | |
26.6% (44.2fps) | 22.6% (30.8fps) | 18.3% (19.0fps) | 16.0% (8.9fps) | Navi 33, 2048 shaders, 2755MHz, 16GB GDDR6@18Gbps, 288GB/s, 190W | |
25.9% (42.9fps) | 21.4% (29.2fps) | 16.8% (17.5fps) | Row 42 - Cell 4 | Navi 22, 2304 shaders, 2450MHz, 10GB GDDR6@16Gbps, 320GB/s, 175W | |
23.2% (38.4fps) | 18.6% (25.4fps) | Row 43 - Cell 3 | Row 43 - Cell 4 | TU106, 1920 shaders, 1680MHz, 6GB GDDR6@14Gbps, 336GB/s, 160W | |
23.1% (38.3fps) | 18.9% (25.7fps) | 14.7% (15.2fps) | Row 44 - Cell 4 | Navi 33, 2048 shaders, 2655MHz, 8GB GDDR6@18Gbps, 288GB/s, 165W | |
22.7% (37.6fps) | 18.8% (25.6fps) | Row 45 - Cell 3 | Row 45 - Cell 4 | Navi 23, 2048 shaders, 2635MHz, 8GB GDDR6@18Gbps, 280GB/s, 180W | |
22.3% (36.9fps) | 18.0% (24.6fps) | Row 46 - Cell 3 | Row 46 - Cell 4 | GA106, 2560 shaders, 1777MHz, 8GB GDDR6@14Gbps, 224GB/s, 130W | |
22.1% (36.7fps) | 18.2% (24.8fps) | Row 47 - Cell 3 | Row 47 - Cell 4 | Navi 23, 2048 shaders, 2589MHz, 8GB GDDR6@16Gbps, 256GB/s, 160W | |
18.6% (30.8fps) | 15.2% (20.7fps) | Row 48 - Cell 3 | Row 48 - Cell 4 | Navi 23, 1792 shaders, 2491MHz, 8GB GDDR6@14Gbps, 224GB/s, 132W | |
11.0% (18.3fps) | Row 49 - Cell 2 | Row 49 - Cell 3 | Row 49 - Cell 4 | ACM-G11, 1024 shaders, 2450MHz, 6GB GDDR6@15.5Gbps, 186GB/s, 75W | |
5.9% (9.9fps) | Row 50 - Cell 2 | Row 50 - Cell 3 | Row 50 - Cell 4 | Navi 24, 1024 shaders, 2815MHz, 4GB GDDR6@18Gbps, 144GB/s, 107W | |
5.0% (8.3fps) | Row 51 - Cell 2 | Row 51 - Cell 3 | Row 51 - Cell 4 | Navi 24, 768 shaders, 2321MHz, 4GB GDDR6@16Gbps, 128GB/s, 53W |
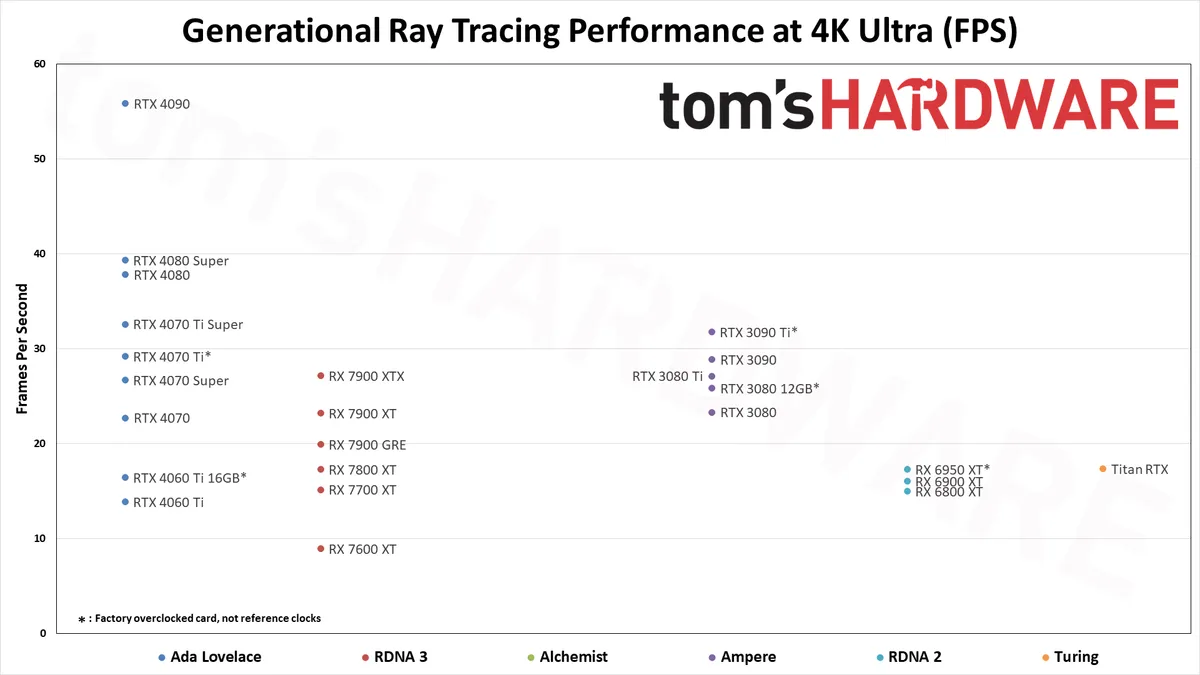
If you felt the RTX 4090 performance was impressive at 4K in our standard test suite, just take a look at the results with ray tracing. Nvidia put even more ray tracing enhancements into the Ada Lovelace architecture, and those start to show up here. There are still further potential performance improvements for ray tracing with SER, OMM, and DMM — not to mention DLSS 3, though that ends up being a bit of a mixed bag, since the generated frames don't include new user input and add latency.
If you want a real kick in the pants, we also ran many of the faster ray tracing GPUs through Cyberpunk 2077's RT Overdrive mode, which implements full "path tracing" (full ray tracing, without any rasterization) — as well as Alan Wake 2, which uses path tracing at higher settings, and Black Myth: Wukong that supports full ray tracing. Those games provide a glimpse of how future games could behave, and why upscaling and AI techniques like frame generation are here to stay.
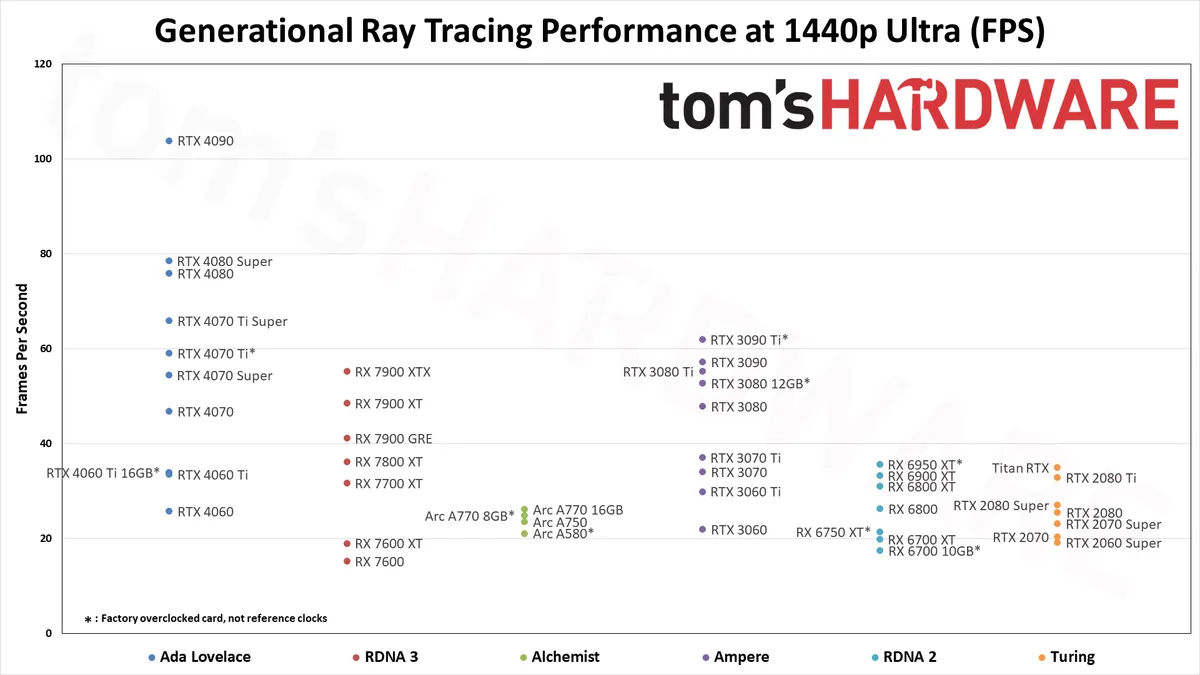
Even at 1080p medium, a relatively tame setting for DXR (DirectX Raytracing), the RTX 4090 roars past all contenders and leads the previous generation RTX 3090 Ti by 41%. At 1080p ultra, the lead grows to 53%, and it's nearly 64% at 1440p. Nvidia made claims before the RTX 4090 launch that it was "2x to 4x faster than the RTX 3090 Ti" — factoring in DLSS 3's Frame Generation technology — but even without DLSS 3, the 4090 is 72% faster than the 3090 Ti at 4K.
AMD continued to relegate DXR and ray tracing to secondary status, focusing more on improving rasterization performance — and on reducing manufacturing costs through the use of chiplets on the new RDNA 3 GPUs. As such, the ray tracing performance from AMD isn't particularly impressive. The top RX 7900 XTX basically matches Nvidia's previous generation RTX 3080 12GB, which puts it barely ahead of the RTX 4070 — and that's not even in all DXR games. There are some minor improvements for RT performance in RDNA 3, though, as the 7800 XT for example ends up basically tied with the RX 6800 XT in rasterization performance but is 10% faster in DXR performance.
Intel's Arc A7-series parts show a decent blend of performance in general, with the A750 coming in ahead of the RTX 3060 overall. With the latest drivers (and with vsync forced off in the options.txt file), Minecraft performance also looks much more in line with the other Arc DXR results.

You can also see what DLSS Quality mode did for performance in DXR games on the RTX 4090 in our review, but the short summary is that it boosted performance by 78% at 4K ultra. DLSS 3 frame generation improved framerates another 30% to 100% in our testing, though we recommend exercising (extreme) caution when looking at FPS with the feature enabled. It can boost framerates in benchmarks, but when actually playing games it often doesn't feel much faster than without the feature.
Overall, with DLSS 2, the 4090 in our ray tracing test suite is nearly four times as fast as AMD's RX 7900 XTX. Ouch. AMD's FSR 2 and FSR 3 can help as well, and AMD continues to work on increasing the rate of adoption, but it still trails DLSS both in the number of games supported and in the overall image quality. Only two of the games in our DXR suite have FSR2 support. By comparison, all of the DXR games we're testing support DLSS2 — and one also supports DLSS3.
Without FSR2, AMD's fastest GPUs can only clear 60 fps at 1080p ultra, while remaining decently playable at 1440p with 40–50 fps on average. But native 4K DXR remains out of reach for just about every GPU, with only the 3090 Ti and above breaking the 30 fps mark on the composite score — and a couple of games still come up short on the 3090 Ti.
AMD also has FSR 3 frame generation. Like DLSS3, it adds latency, and AMD requires the integration of Anti-Lag+ support in games that use FSR 3. But Anti-Lag+ only works with AMD GPUs, which means non-AMD cards will likely incur a larger latency penalty. We've tested it in Avatar: Frontiers of Pandora and found it worked pretty well, but that was not the case in Forspoken and Immortals of Aveum. It has since gained a lot more traction, though quality and latency remain quite variable — it can look and run well in one game, and then fall flat in another.
The midrange GPUs like the RTX 3070 and RX 6700 XT basically manage 1080p ultra and not much more, while the bottom tier of DXR-capable GPUs barely manage 1080p medium — and the RX 6500 XT can't even do that, with single digit framerates in most of our test suite, and one game that wouldn't even work at our chosen "medium" settings. (Control requires at least 6GB VRAM to let you enable ray tracing.)
Intel's Arc A380 ends up just ahead of the RX 6500 XT in ray tracing performance, which is interesting considering it only has 8 RTUs going up against AMD's 16 Ray Accelerators. Intel posted a deep dive into its ray tracing hardware, and Arc seems reasonably impressive, except for the fact that the number of RTUs severely limits performance. The top-end A770 still only has 32 RTUs, which proves sufficient for it to pull ahead (barely) of the RTX 3060 in DXR testing, but it can't go much further than that. Arc A750 and above also ends up ahead of AMD's RX 6750 XT in DXR performance, showing just how poor AMD's RDNA 2 hardware is when it comes to ray tracing.
It's also interesting to look at the generational performance of Nvidia's RTX cards. The slowest 20-series GPU, the RTX 2060, still outperforms the newer RTX 3050 by a bit, but the fastest RTX 2080 Ti comes in a bit behind the RTX 3070. Where the 2080 Ti basically doubled the performance of the 2060, the 3090 delivers about triple the performance of the 3050.

Test System and How We Test for GPU Benchmarks
For each graphics card, we follow the same testing procedure. We run one pass of each benchmark to "warm up" the GPU after launching the game, then run at least two passes at each setting/resolution combination. If the two runs are basically identical (within 0.5% or less difference), we use the faster of the two runs. If there's more than a small difference, we run the test at least twice more to determine what "normal" performance is supposed to be.
We also look at all the data and check for anomalies, so for example RTX 3070 Ti, RTX 3070, and RTX 3060 Ti all generally going to perform within a narrow range — 3070 Ti is about 5% faster than 3070, which is about 5% faster than 3060 Ti. If we see games where there are clear outliers (i.e. performance is more than 10% higher for the cards just mentioned), we'll go back and retest whatever cards are showing the anomaly and figure out what the "correct" result would be.
Due to the length of time required for testing each GPU, updated drivers and game patches inevitably will come out that can impact performance. We periodically retest a few sample cards to verify our results are still valid, and if not, we go through and retest the affected game(s) and GPU(s). We may also add games to our test suite over the coming year, if one comes out that is popular and conducive to testing — see our what makes a good game benchmark for our selection criteria.
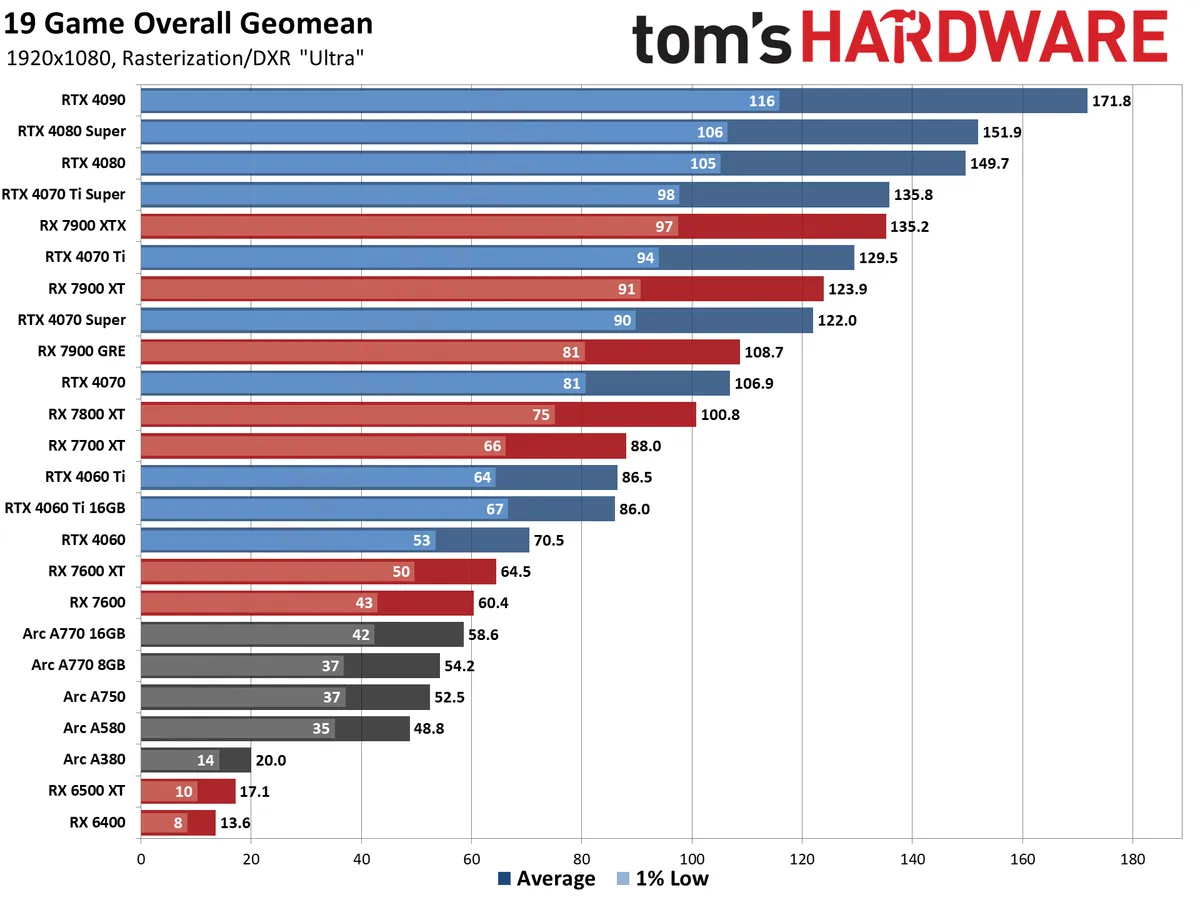
GPU Benchmarks: Individual Game Charts
The above tables provide a summary of performance, but for those that want to see the individual game charts, for both the standard and ray tracing test suites, we've got those as well. We're only including more recent GPUs in these charts, as otherwise things get very messy. These are also using a newer test suite and a 13900K CPU, which changes the performance slightly from the above table, simply because our newest tests are more relevant (but haven't been run on a lot of the older GPUs shown in the tables).
These charts were up to date as of November 11, 2024.
GPU Benchmarks — 1080p Medium


GPU Benchmarks — 1080p Ultra


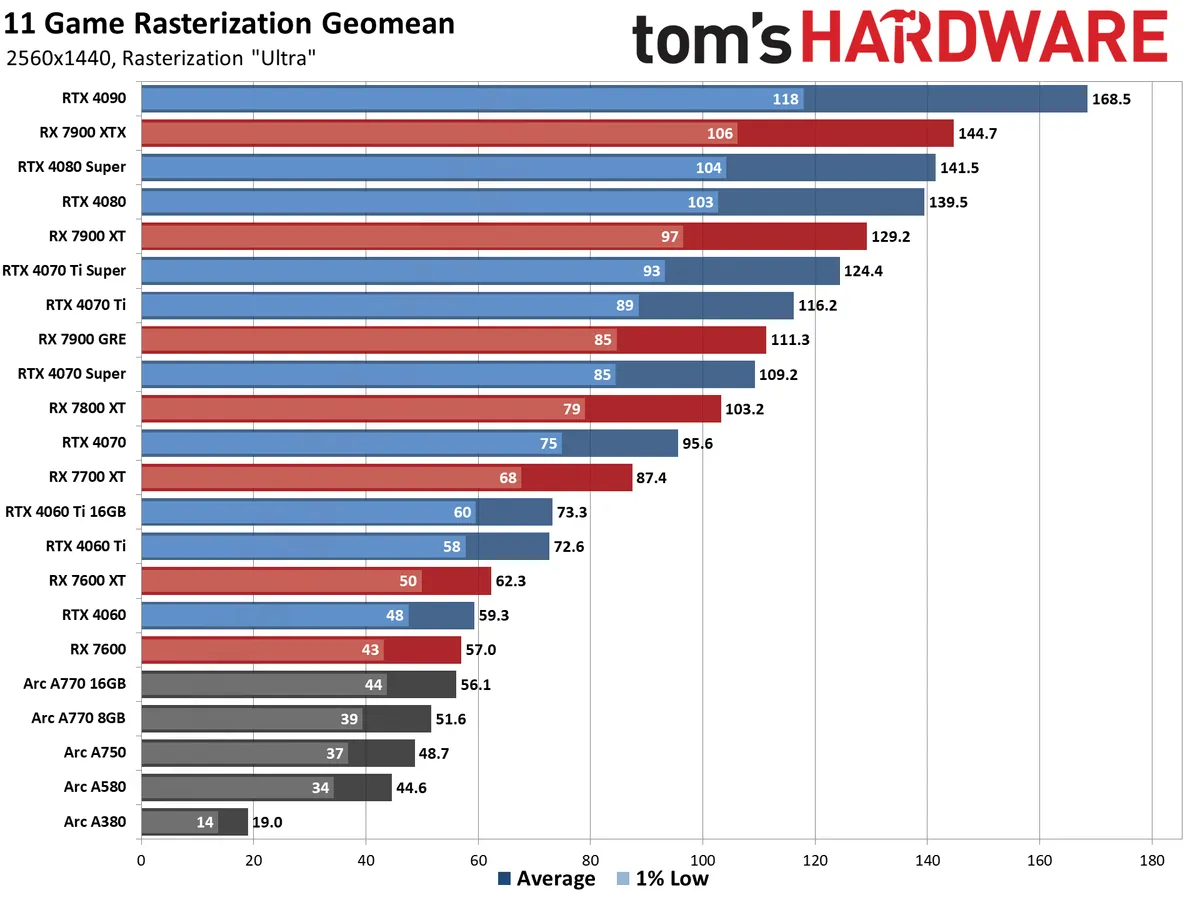
GPU Benchmarks — 1440p Ultra


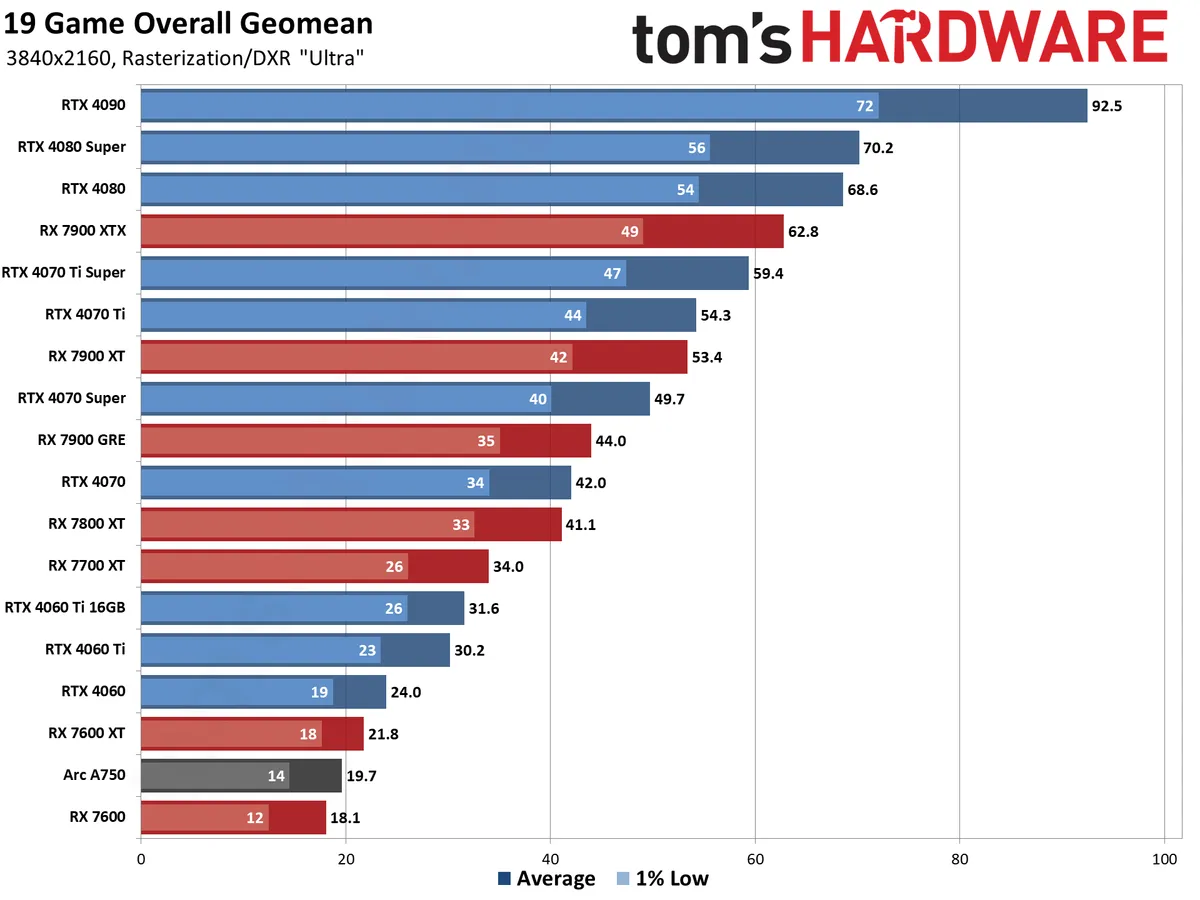
GPU Benchmarks — 4K Ultra


GPU Benchmarks — Power, Clocks, and Temperatures
Most of our discussion has focused on performance, but for those interested in power and other aspects of the GPUs, here are the appropriate charts.