GPU Benchmarks Introduction
Tom's Hardware exhaustively benchmarks every GPU to find out which are worthy of our list of the best graphics cards. Our GPU benchmarks hierarchy ranks current and previous generation graphics cards by performance. Whether it's playing games, running artificial intelligence workloads like Stable Diffusion, or doing professional video editing, your graphics card typically plays the biggest role in determining performance — even the best CPUs for gaming take a secondary role.
We have benchmarking data for all Nvidia, AMD, and Intel graphics cards from last year, except for a couple of the latest GeForces and Radeons, thanks to our outgoing GPU editor Jarred Walton. For a look at those missing cards, check out our recent RTX 5050 review, which covers the RTX 5050 and RX 9060 XT 8GB.
We're finalizing our new GPU test suite and expect to test at least three complete generations of AMD and Nvidia hardware against it in the near future. Stay tuned for that update.
Looking broadly at the state of the GPU market, prices for most graphics cards have fallen to the lowest we've seen in the last year for most products. It's now easy to get most graphics cards for close to — or even less than — MSRP. Even the historically overpriced $549 Radeon RX 9070 and $599 RX 9070 XT finally have at least one model that's generally available from stock at MSRP.
Things remain less rosy for buyers at the very highest end of the market, where Nvidia still enjoys unchallenged dominance. You can still find a $999 RTX 5080 here and there if you look around, but prices for those cards remain elevated. RTX 5090 prices are also nowhere near Nvidia's $1999 sticker, thanks to the combination of high demand and a lack of an AMD competitor at that end of the market.
The overarching problem for graphics card buyers is that the AI data center gold rush is sucking up every available silicon wafer across product categories like flash memory, DDR5 RAM, GDDR memory, and logic alike, and these relatively low prices are unlikely to last.
The price of DDR5 DIMMs is already out of control, and we expect that the prices of other PC components that include onboard memory, like graphics cards, will rise soon.
If you need a new GPU for your build or a graphics card upgrade, now is the time to buy. Don't hesitate.
Let's dive into our ranking of GPUs past and present so you can figure out how all those cards stack up.
Our full GPU hierarchy using traditional rendering (aka rasterization) comes first, and below that we have our separate ray tracing hierarchy. The results are all collected at native resolution, without enabling DLSS, FSR, or XeSS upscaling or frame generation. Below the gaming results, you'll find our Content Creation Hierarchy, which ranks the GPUs based on their performance in AI benchmarks and professional apps.
This update includes all gaming and productivity data and accounts for the current state of the graphics card market as we work on our new test suite and hierarchy. In short: if you need a new GPU, buy now before prices get out of control due to the AI data center boom.
As a brief refresher of the cards in this version of our hierarchy, Nvidia's cutting-edge Blackwell architecture and its DLSS 4 suite of tech upgrades the quality of both upscaling and ray reconstruction on RTX 50-series GPUs. It also adds Multi Frame Generation support. When it works, MFG can add one, two, or three AI-generated frames in between natively rendered ones.
Even if you're not into framegen, DLSS 4 upscaling and its transformer neural network architecture can offer a big boost in image quality at the same output resolution compared to earlier DLSS versions. That tech can benefit all GeForce RTX GPUs going back to the RTX 20-series, albeit at a performance cost on older hardware compared to earlier DLSS versions.
Nvidia's Ada Lovelace architecture powers its prior-gen RTX 40-series cards. Ada introduced DLSS Frame Generation, which can double output frame rates in supported games. Ada can't benefit from MFG, though.
AMD's Radeon RX 9000 series cards, powered by its latest RDNA 4 architecture, get a big boost to both ray-tracing and AI capabilities with new RT and matrix math accelerators. AMD uses those capabilities to enable its FSR 4 upscaler and its much-improved image quality in a small but growing range of titles. RX 9000-series cards will also benefit from the upcoming FSR Redstone update and its range of further image quality improvements.
Meanwhile, the last-gen RDNA 3 architecture powers seven RX 7000-series seven desktop cards. RDNA 3 cards can't officially run FSR 4 upscaling, and they're unlikely to benefit from any future FSR Redstone improvements.
Intel's Battlemage-powered Arc B580 and Arc B570 offer major improvements in performance and efficiency compared to its Alchemist architecture. Battlemage only serves the entry-level end of the graphics card market today, though rumors of a bigger, more powerful Battlemage GPU persist. Only time will tell if Intel has a bigger Battlemage chip up its sleeve.
On page two, you'll find our 2024–2022 benchmark suite, which has all the previous generation GPUs running an older test suite and a Core i9-12900K. Page three has an even older 2020–2021 test suite with only rasterization games, running on a Core i9-9900K testbed. The legacy tables are no longer being actively updated. There's also the "Ancient Legacy GPU hierarchy" (without benchmarks, sorted by theoretical performance) for reference purposes on page three.
The following tables sort everything solely by our performance-based GPU benchmarks, from fastest to slowest. Factors including real-world pricing, graphics card power consumption, overall efficiency, and features aren't factored into the rankings here. The latest results use an AMD Ryzen 7 9800X3D testbed. Here are the tables and benchmark results — rasterization games first, then ray tracing games, and finally the content creation results.
Rasterization GPU Benchmarks 2026
For our latest GPU benchmarks, we test every card at 1080p medium and 1080p ultra settings. We then test at 1440p ultra and 4K ultra to really separate each card from the rest.
All the scores are expressed as percentages relative to the top-ranking 1080p ultra card, which is of course the GeForce RTX 5090.
We have 14 rasterization games we're using for the latest test suite:
- Assassin's Creed Mirage
- Baldur's Gate 3
- Black Myth Wukong
- Dragon Age: The Veilguard
- Final Fantasy XVI
- Flight Simulator 2020
- Flight Simulator 2024
- God of War Ragnarök
- Horizon Forbidden West
- The Last of Us Part 1
- A Plague Tale: Requiem
- Spider-Man 2
- Stalker 2
- Starfield
- Warhammer 40,000: Space Marine 2
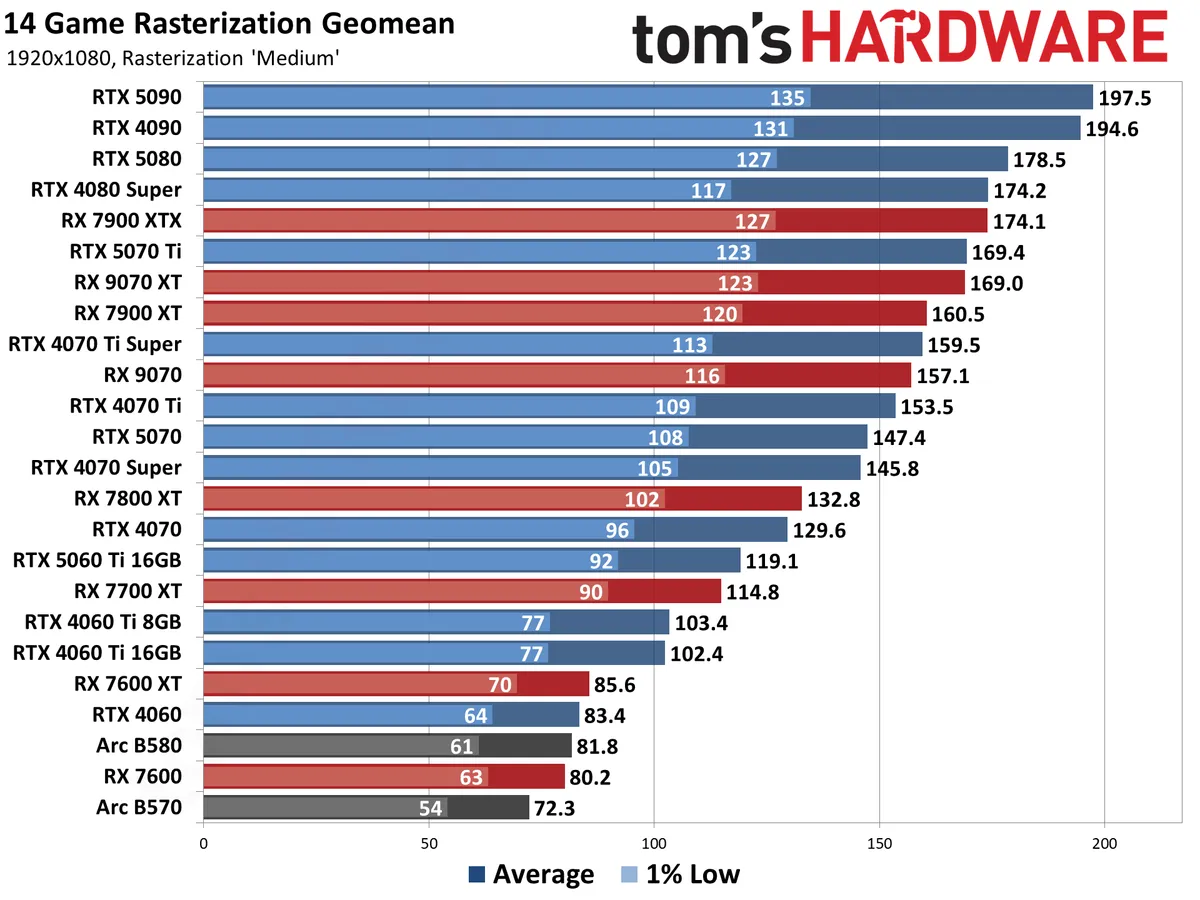
The FPS score is the geometric mean (equal weighting) of all 14 games. Note that the specifications column links directly to our original review for the various GPUs.


Rasterization GPU Benchmarks, Key Findings
- The RTX 5090 takes the top spot across the board, but prices remain elevated and have been since launch. It can also end up CPU limited at anything below 4K ultra. It's an exotic purchase requiring a massive power supply and a 4K 240Hz monitor to fully enjoy for gaming.
- The best GPU value at 1080p, judged by FPS per dollar, is the GeForce RTX 5060 8GB, but its small VRAM pool can cause issues at higher settings with the latest games. Our early testing suggests the similarly-priced Radeon RX 9060 XT 8GB has fewer struggles with games that spill out of its VRAM.
- The Editor's Choice-winning, $380-ish Radeon RX 9060 XT 16GB comes in second in our 1080p value standings. It's faster than even the hard-to-recommend RTX 5060 Ti 8GB and offers twice the VRAM.
- For the best value at 1440p, you want the RX 9060 XT 16GB or the $430 GeForce RTX 5060 Ti 16GB.
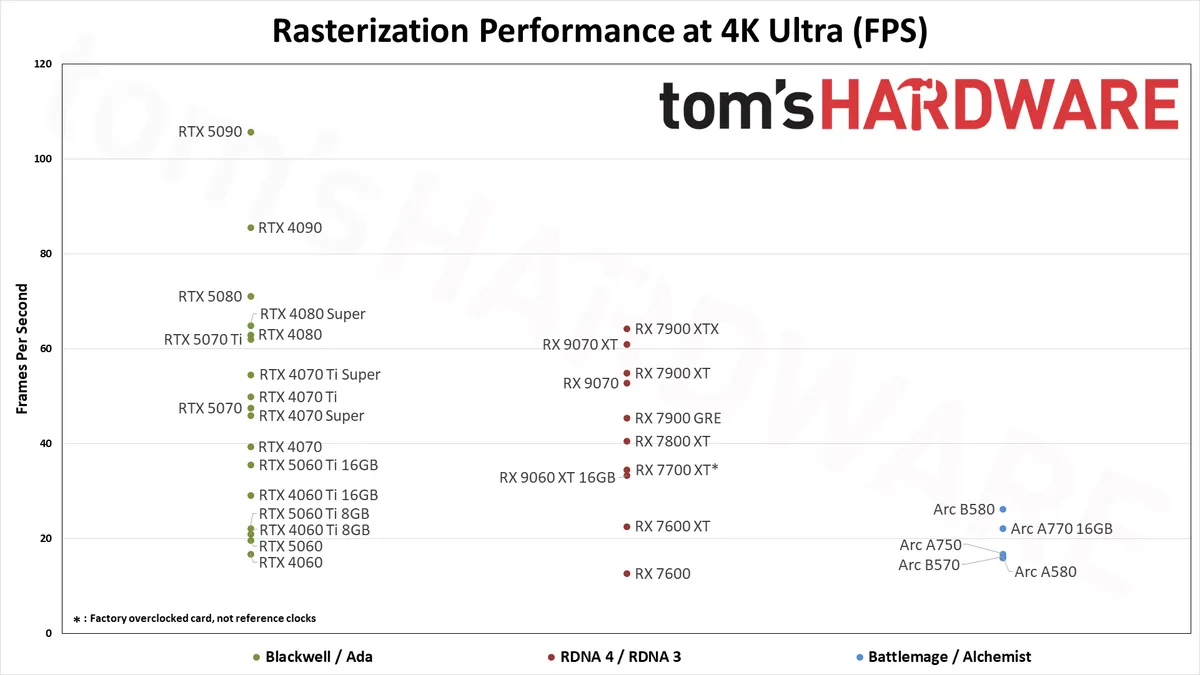
- At 4K, AMD's Radeon RX 9070 XT is the best value in a card that can deliver 60 FPS on average in our test suite. The GeForce RTX 5070 Ti delivers practically identical performance without upscaling, but DLSS and MFG are features we like to have at this resolution, so you might consider spending slightly more on Nvidia's contender.
Rasterization GPU Benchmarks Rankings 2026
Keep in mind that we're not including any ray tracing or DLSS results in the above table, as we use the same test suite with the same settings on all current and previous generation graphics cards. Only GeForce RTX cards support DLSS. AMD's latest FSR 4 and Intel's XeSS upscalers are less widely supported in general. More importantly, all three upscaling solutions offer differing image quality, and we want to keep things directly comparable.
One thing that becomes immediately obvious is just how little separation there is between the fastest GPUs at lower resolutions. In some games, there may not even be much of a difference between the RTX 5090 and RTX 4090 at 4K ultra if you're running in pure rasterization mode.
Looking at the overall results, while the 5090 ends up 24% faster than the 4090 at 4K, it's only 13% faster at 1440p, 5% faster at 1080p ultra, and just 1.5% faster at 1080p medium.
The takeaway: don't buy any of the cards at the top of our hierarchy without a high-refresh-rate 2560x1440 or 4K monitor to match. Even one of our best gaming CPUs, like the Ryzen 7 9800X3D, can only do so much when a powerful card gets CPU-bound at lower resolutions and settings.
Our raster-only numbers put AMD's last-gen RX 7900 XTX above the RX 9070 XT, but that doesn't give AMD's highest-end RDNA 4 card enough credit. It's much more capable in ray-traced games, as you'll see shortly, and it draws less power than the 7900 XTX under load.
The same goes for the RX 9060 XT 16GB, which trades blows with the RX 7700 XT in raster-only games but shadows the much more expensive 7800 XT with RT in play.
What about Intel? The $260-ish Arc B580 represents Team Blue's best card right now, but it's very much a budget part. It trades blows with the last-gen RTX 4060 and RX 7600 XT. For just a few bucks more, the RTX 5060 and RX 9060 XT 8GB blow the doors off the Battlemage card. The RTX 5060 is 27% faster at 1080p ultra, and our early testing of the frequently-available-for-below-MSRP RX 9060 XT 8GB suggests a similar margin. We don't think the extra potential longevity afforded by the B580's 12GB of VRAM is worth the massive performance tradeoff versus current-gen 8GB GPUs.
The $230 Arc B570 trades blows with remaining RTX 3060 12GB cards, which can be had for as low as $250 right now, but if you're shopping at this end of the market, we strongly suggest searching out a cheap Radeon RX 9060 XT 8GB for just a few bucks more. The 9060 XT 8GB handily outperforms both of these older products.

Ray Tracing GPU Benchmarks 2026
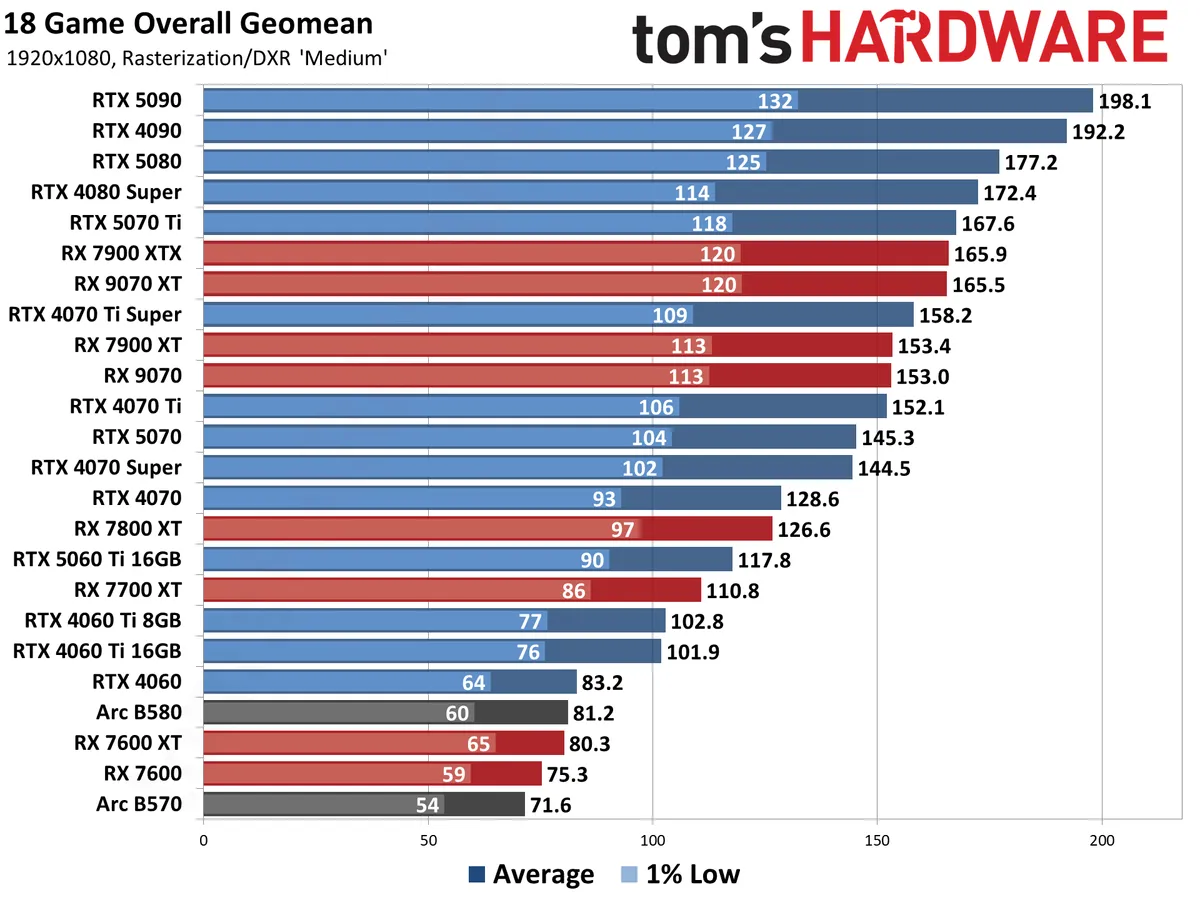
Enabling ray tracing, particularly with the most demanding games, can cause framerates to drop off a cliff. As with our raster games, we're testing with 1080p "medium" and "ultra" ray tracing settings, and "ultra" for 1440p and 4K. Medium generally means using the medium graphics preset but turning on ray tracing effects (set to "medium" if that's an option; otherwise, "on"), while ultra turns on all of the RT options at more or less maximum quality.
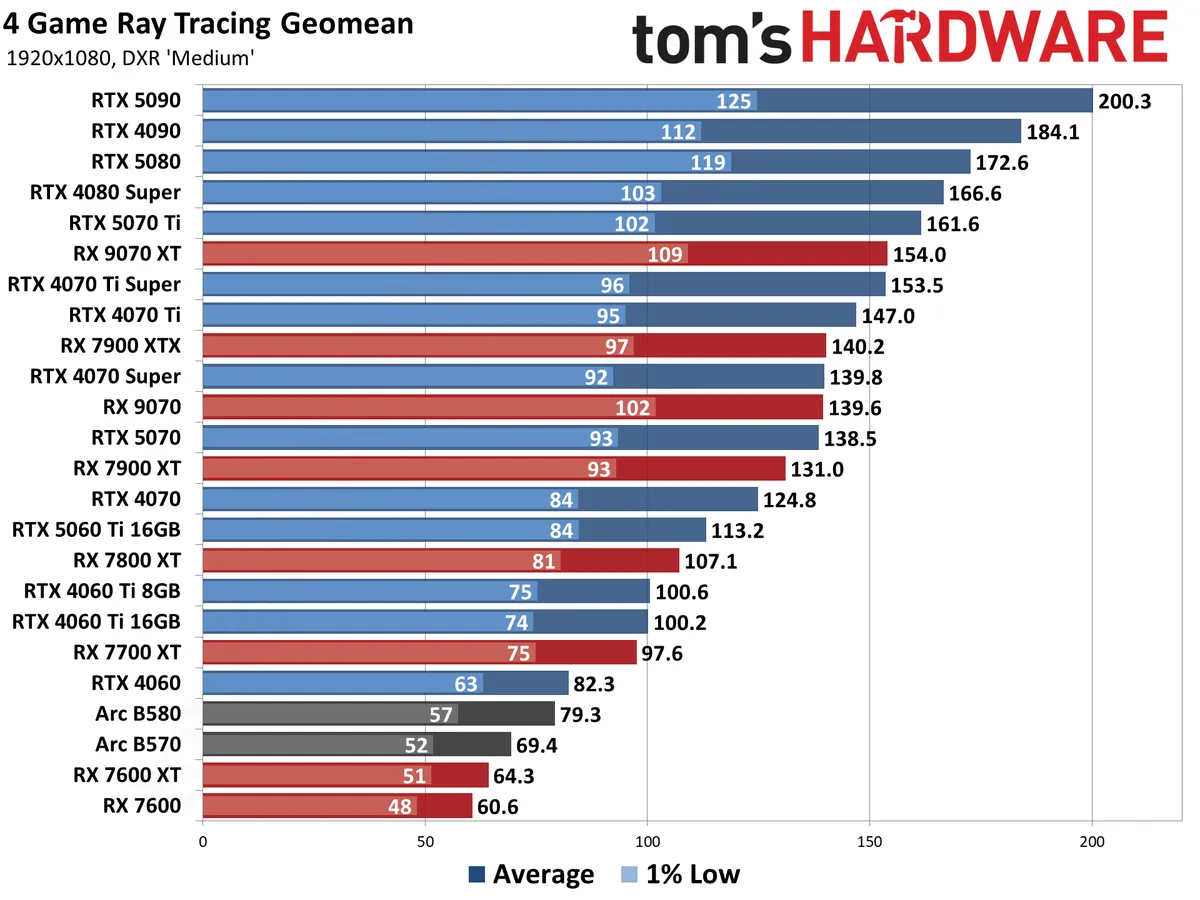
The four ray tracing games we're using right now are Avatar: Frontiers of Pandora (a lighter RT title), Cyberpunk 2077 (heavy RT), F1 '24 (lighter RT), and Spider-Man: Miles Morales (moderate RT). The FPS score is the geometric mean (equal weighting) of the four games, and the percentage is scaled relative to the fastest GPU in the list, which again is the GeForce RTX 5090.
If you want to see what truly heavy amounts of ray tracing can do, check out our Alan Wake 2 benchmarks, where the full path tracing barely produces playable performance even with upscaling.
However—and this is a critical point—the number of games where RT makes a striking difference in visuals is extremely limited. For most games, we still feel running pure rasterization rendering makes more sense if performance is a priority.


Ray Tracing GPU Benchmarks, Key Findings and Notes
- The RTX 5090 stretches its legs a bit more with RT enabled, as expected.
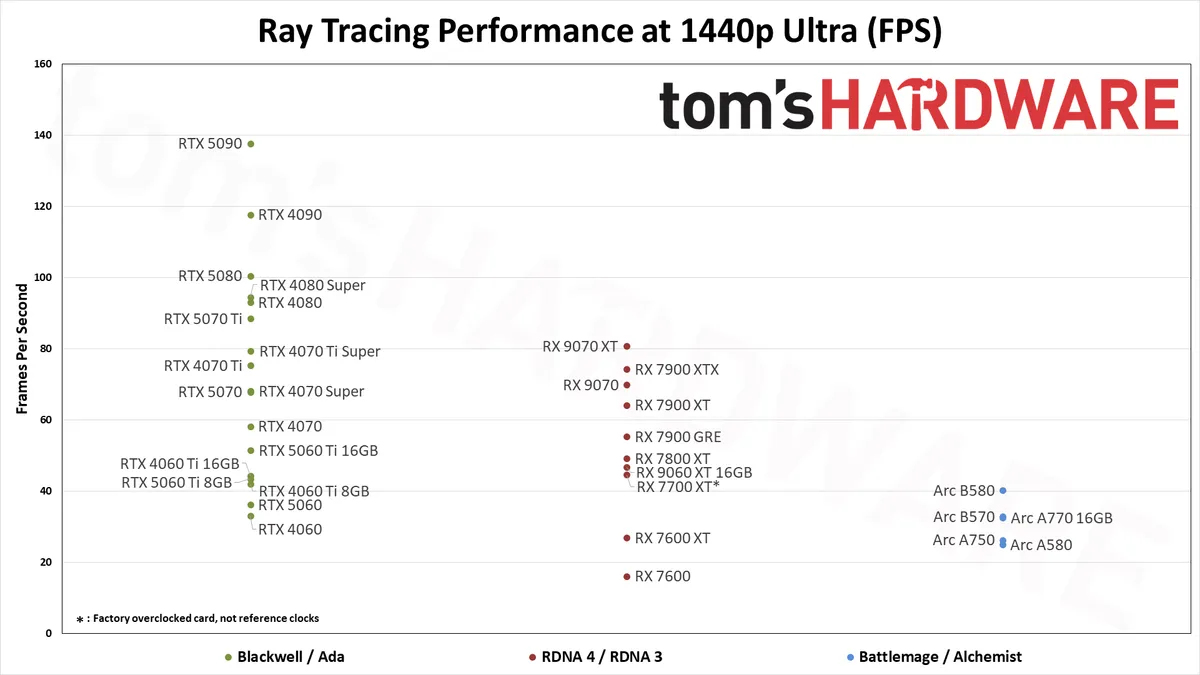
- AMD's RX 9070 XT outperforms the RX 7900 XTX in our RT tests, showing that the ray-tracing improvements in RDNA 4 deliver.
- Even with those improvements, the RX 9070 XT can only manage a tie with the RTX 4070 Ti Super with RT in play, coming in tenth place overall.
- Maintaining 60 FPS in RT titles (as a good foundation for upscaling and framegen enhancements) is a very tall order. Among recent products, you'll want:
- an RTX 4060 Ti 16GB, RTX 5060 Ti 16GB, or RX 9060 XT 16GB to do RT at 1080p without running out of VRAM
- An RTX 4070, an RTX 5070 or RX 9070 at 1440p, or an RX 9070 XT or RTX 5070 Ti for the best possible experience
- An RTX 5080, RTX 4090, or RTX 5090 at 4K
Ray Tracing GPU Benchmarks Rankings 2026
Ray tracing pushes the GPUs a lot harder, depending on the game, which results in a wider performance spread across the GPUs we've tested. The 5090 still takes the pole position, with the 4090 in second place, but now there's at least an 8% gap at 1080p, and that increases to 17% at 1440p and 27% at 4K.
The gap between the 4090 and 5080 is also wider at 1440p and 4K, where the previous generation part is 17% and 24% faster, respectively.
If you want to enjoy high-end RT without a 4090- or 5090-sized bankroll, the RTX 5070 Ti proves itself as the last card with a reasonable price-to-performance ratio before things get crazy.
If you omit our potentially CPU-bound 1080p medium results from the picture, which are more academic than anything, the 5070 Ti is just a couple frames off the absurdly overpriced RTX 5080 across the board. It even beats out the RTX 4080 Super, whose position in the RT hierarchy comes down to its 1080p medium results more than from any practical use case.
AMD's fastest ray tracing GPU is the new RX 9070 XT, outpacing the 7900 XTX across all tested resolutions. It's 8–11 percent faster, with the biggest gap at 4K — at resolution where normally the extra memory and bandwidth of the XTX would come into play.
But the 9070 XT can only trade blows with the RTX 4070 Ti Super with Nvidia competition in the picture, winning by a tiny amount at 1080p medium and 1440p ultra, and losing by an equally tiny amount at 1080p ultra and 4K ultra.
Dollar for dollar (or close to it), the RTX 5070 Ti remains a better choice for a new RT-focused build.
Intel's Arc B580 still leads the A770, by a slightly larger margin this time. It's also generally a better pick than the RTX 4060 due to the lack of VRAM on Nvidia's card, assuming prices are similar. AMD's budget RX 7600 and 7600 XT fall off the pace with RT enabled due to architectural shortcomings.
Honestly, though, the Radeon RX 9060 XT 16GB is the cheapest current card worth buying if you're interested in turning on RT at 1080p. Anything cheaper either lacks the horsepower or VRAM—or both—to deliver a good RT experience. And if you can spend slightly more, the RTX 5060 Ti 16GB brings DLSS upscaling and MFG to the table for even more RT performance fine-tuning.
Content Creation GPU Benchmarks Rankings 2026
With our new test suite, we're also benchmarking every GPU possible in content creation tasks. These consist of AI workloads like Stable Diffusion 1.5/XL, Procyon's AI Vision suite, MLPerf Client 0.5, SPECworkstation 4.0, and Blender. For gamers, most of these test results are superfluous, but those who plan to use their GPU for other tasks may find the information to be useful.
The individual test results in this suite can swing wildly, depending on the GPU in question, which makes the overall rankings a bit harder to determine. We've used the geometric mean of all the benchmarks for the score, but it's important to check the individual application results for the workloads you plan on running. We've included the charts directly below the main table for our Content Creation GPU Hierarchy.


Nvidia's RTX 50- and 40-series GPUs absolutely dominate in the Stable Diffusion AI workloads as well as in Blender 3D rendering.
MLPerf Client and its LLM tests show Nvidia and Intel cards performing well versus Radeons in the latency-focused Time to First Token metric, but the more powerful GPUs fall more where we'd expect in the throughput-focused Tokens per Second results.
The Procyon AI Vision suite also heavily favors Nvidia GPUs. Even the new Intel Arc Battlemage chips rank ahead of AMD, but AMD's chips have to run that particular test in FP16 mode, while Intel and Nvidia perform substantially better with optimized INT8 pathways using OpenVINO and TensorRT, respectively.
SPECworkstation 4.0's GPU inference tests still favor Nvidia, but AMD closes the gap — and Intel falls to the bottom of the list. The Handbrake video transcoding tests only focus on raw throughput, without regards to encoding quality, with Intel's Battlemage and AMD's new RDNA 4 GPUs basically tied at the top, then there's a step down to the AMD RDNA 3 GPUs, and finally all the Nvidia GPUs clump together — though the Blackwell RTX 50-series cards do land slightly ahead of the older 40-series parts.
Finally, we have SPECworkstation's Viewport test suite, an updated selection of the tests used in SPECviewperf 2020. AMD's drivers offer more tuning for these tasks, while Nvidia restricts performance for the non-professional GPUs. Certain tests favor Nvidia still (3ds Max and Solidworks) while others (Catia, Creo, Energy, and Medical) heavily favor AMD's GPUs and drivers.
Intel's consumer drivers are not particularly optimized for these tests, and so Arc GPUs are mostly in the bottom positions — which isn't entirely unexpected considering they're also the least expensive GPUs that we've tested in our Content Creation suite.
Test Setup and Hardware for GPU Benchmarks
We've used several different PCs for our testing over the years. The latest update switches to an AMD Zen 5 processor: the unparalleled Ryzen 7 9800X3D and its 3D V-Cache-enhanced performance.
Here are the specifications for our latest GPU test PC.
Tom's Hardware 2026 GPU Benchmarks Testbed
AMD Ryzen 7 9800X3D
ASRock X670E Taichi
Corsair 2x16GB DDR5-6000 CL30
Crucial T700 4TB
Corsair HX1500i Platinum
Cooler Master MasterLiquid Pro 280 RGB
Windows 11 Pro 64-bit 24H2
For each graphics card, we follow the same testing procedure. We run one pass of each benchmark to "warm up" the GPU after launching the game, then run at least two passes at each setting/resolution combination. If the two runs are basically identical (within 0.5% or less difference), we use the faster of the two runs. If there's more than a small difference, we run the test at least twice more to determine what "normal" performance is supposed to be.
We also look at all the data and check for anomalies, so for example RTX 5070 Ti should be faster than RTX 5070, unless we are CPU bottlenecked, in which case the two GPUs should be basically tied. If we see games where there are clear outliers (i.e. a 'slower' card outperforms a 'faster' card), we'll go back and retest whatever cards are showing the anomaly and figure out what the "correct" result would be.
Due to the length of time required for testing each GPU, updated drivers and game patches inevitably will come out that can impact performance. We periodically retest a few sample cards to verify our results are still valid, and if not, we go through and retest the affected game(s) and GPU(s). We may also add games to our test suite over the coming year, if one comes out that is popular and conducive to testing — see our what makes a good game benchmark for our selection criteria.
GPU Benchmarks: Individual Game Charts
The above tables provide a summary of performance, but for those that want to see the individual game charts, for both the standard and ray tracing test suites, we've got those as well. We're only including more recent GPUs in these charts, as otherwise things get very messy.
These charts are up to date as of April 17, 2025.
GPU Benchmarks — 1080p Medium


GPU Benchmarks — 1080p Ultra


GPU Benchmarks — 1440p Ultra


GPU Benchmarks — 4K Ultra


GPU Benchmarks — Power, Clocks, and Temperatures
Most of our discussion has focused on performance, but for those interested in power and other aspects of the GPUs, here are the appropriate charts. We'll run these from highest to lowest settings, as 4K ultra tends to be the most strenuous workload on most of these GPUs.


If you're looking for the legacy GPU hierarchy, head over to page two! We moved it to a separate page to help improve load times in our CMS as well as for the main website. And if you're looking to comment on the GPU benchmarks hierarchy, head over to our forums and join the discussion!
Choosing a Graphics Card
Choosing a Graphics Card
Which graphics card do you need? To help you decide, we created this GPU benchmarks hierarchy consisting of dozens of GPUs from the past four generations of hardware. Not surprisingly, the fastest cards are using the latest GPU architectures, though they're not always a major upgrade over the prior generation.
Of course it's not just about playing games. Many applications use the GPU for other work, and we cover professional GPU benchmarks in our full GPU reviews. But a good graphics card for gaming will typically do equally well in complex GPU computational workloads. Buy one of the top cards and you can run games at high resolutions and frame rates with the effects turned all the way up, and you'll be able to do content creation work as needed. Drop down to the middle and lower portions of the list and you'll need to start dialing down the settings to get acceptable performance in regular game play and GPU benchmarks.
If your main goal is gaming, you can't forget about the CPU. Getting the best possible gaming GPU won't help you much if your CPU is underpowered and/or out of date. So be sure to check out the Best CPUs for gaming page, as well as our CPU Benchmarks Hierarchy to make sure you have the right CPU for the level of gaming you're looking to achieve.